Incorta Nexus Insight Generation
The Incorta Nexus feature enables users to create interactive visualizations through natural language prompts. This document explains how to use Nexus to generate insights, edit them, and understand the underlying data, and how to use insights as context within a dashboard, and modify the underlying SQL through Query Breakdown.
Starting 2025.7.1, Incorta Copilot has been renamed to Incorta Nexus.
Use the /insight command
To generate a visualization:
- Type
/insightfollowed by your prompt- Example:
/insight calculate the composition of lifestyle segment across my customers
- Example:
- Press Enter or select the send button (arrow icon)
Starting 2025.7.1, you no longer need to use the /insight command. This is now the default behavior. Simply type your question directly in Nexus Chat.
Understand generated Insights
When Nexus processes your request, it:
- Interprets your natural language prompt
- Identifies relevant dimensions and measures
- Selects the appropriate visualization type
- Creates and displays the visualization with a descriptive title
Access the Insight editor
To modify a generated insight:
- Select the Open icon in the top-right corner of the insight
- This opens the Insight in the Analyzer interface
Save the Insights
After creating or editing an insight:
- Select Save in the top-right corner
- Select a dashboard to add the insight to
Examine the Result Set
Underlying every insight is a Spark SQL result set. To view, open Manage Dataset, go to the Result Set tab, and select the pencil icon of the SQL result set. This SQL can be directly edited.
Insight as Context
Use Nexus to ask questions about a specific insight within a dashboard and generate answers in the form of insights. These answers appear within Nexus chat and cannot be added as Incorta insights.
Enable a dashboard for Nexus
- In the Action bar, select the Information (i) icon.
- In the Information tab, under the General section, toggle on the Enabled for Nexus option.
Use insight as context
- Hover over an insight within the dashboard enabled for Nexus.
- Select the Nexus icon from the insight’s top-right menu.
- Ask a question about the insight’s data, and Nexus provides the answer.
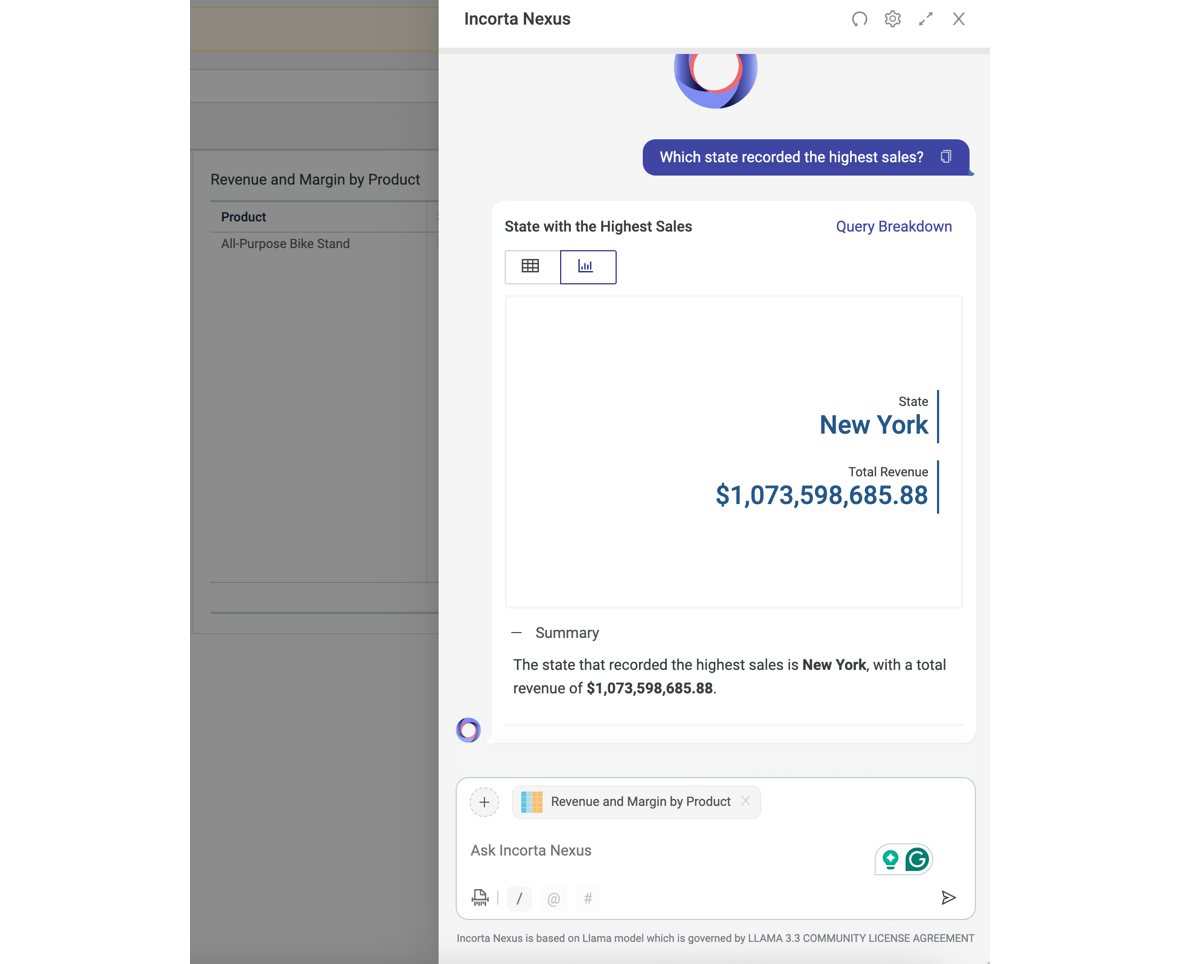
Example
For the "Revenue and Margin by Product" insight, select the Nexus icon, and ask, “Which state recorded the highest sales?” Nexus Chat analyzes the underlying data and returns the result as an insight. You can also switch the visualization by selecting the Table icon to view the answer in a tabular format.
- This feature is available starting 2025.7.1.
- Nexus supports insights with a limit of 20,000 rows. You can filter larger insights to reduce the dataset.
- A Nexus session lasts 1 hour and works in a single tab. Opening the instance in a new tab does not retain your chat history.
Query Breakdown
In Nexus Chat, use Query Breakdown to view the SQL and logic of a generated insight or forecast. The option appears at the top-right of a Nexus Chat answer.
Edit SQL
Users with Edit access to the underlying business schema can modify the SQL queries generated by Nexus.
To edit an SQL query:
- Select Query Breakdown within Nexus Chat
- In the Query Breakdown dialog, select Edit SQL.
- Modify the query and select Save. The updated query is submitted as a new question, and Nexus responds based on the refined input.
The Edit SQL feature is available starting 2025.7.1.
Best practices for Nexus Insights
- Be specific in your prompts: "Calculate the composition of lifestyle segment" is better than "Show me customer data"
- Reference column names: Use column terminology that matches your data model
- Start simple, then refine: Begin with basic insights, then use the editor to customize
- Examine the result set: Understanding the underlying data helps create more meaningful insights
- Iterative refinement: If the initial insight isn't exactly what you need, refine your prompt or use the editor
- Explicit directions: If you desire a specific insight type for visualization, mention it in your prompt.