Data Applications → Analyze Sales
Sales dashboard folder
The Sales dashboard folder component represents the sales functional area in Incorta Cloud. It includes five prebuilt dashboards:
- Sales Executive Overview
- Pipeline Analysis
- Sales Performance and Coaching
- Opportunity History
- Opportunity Detail
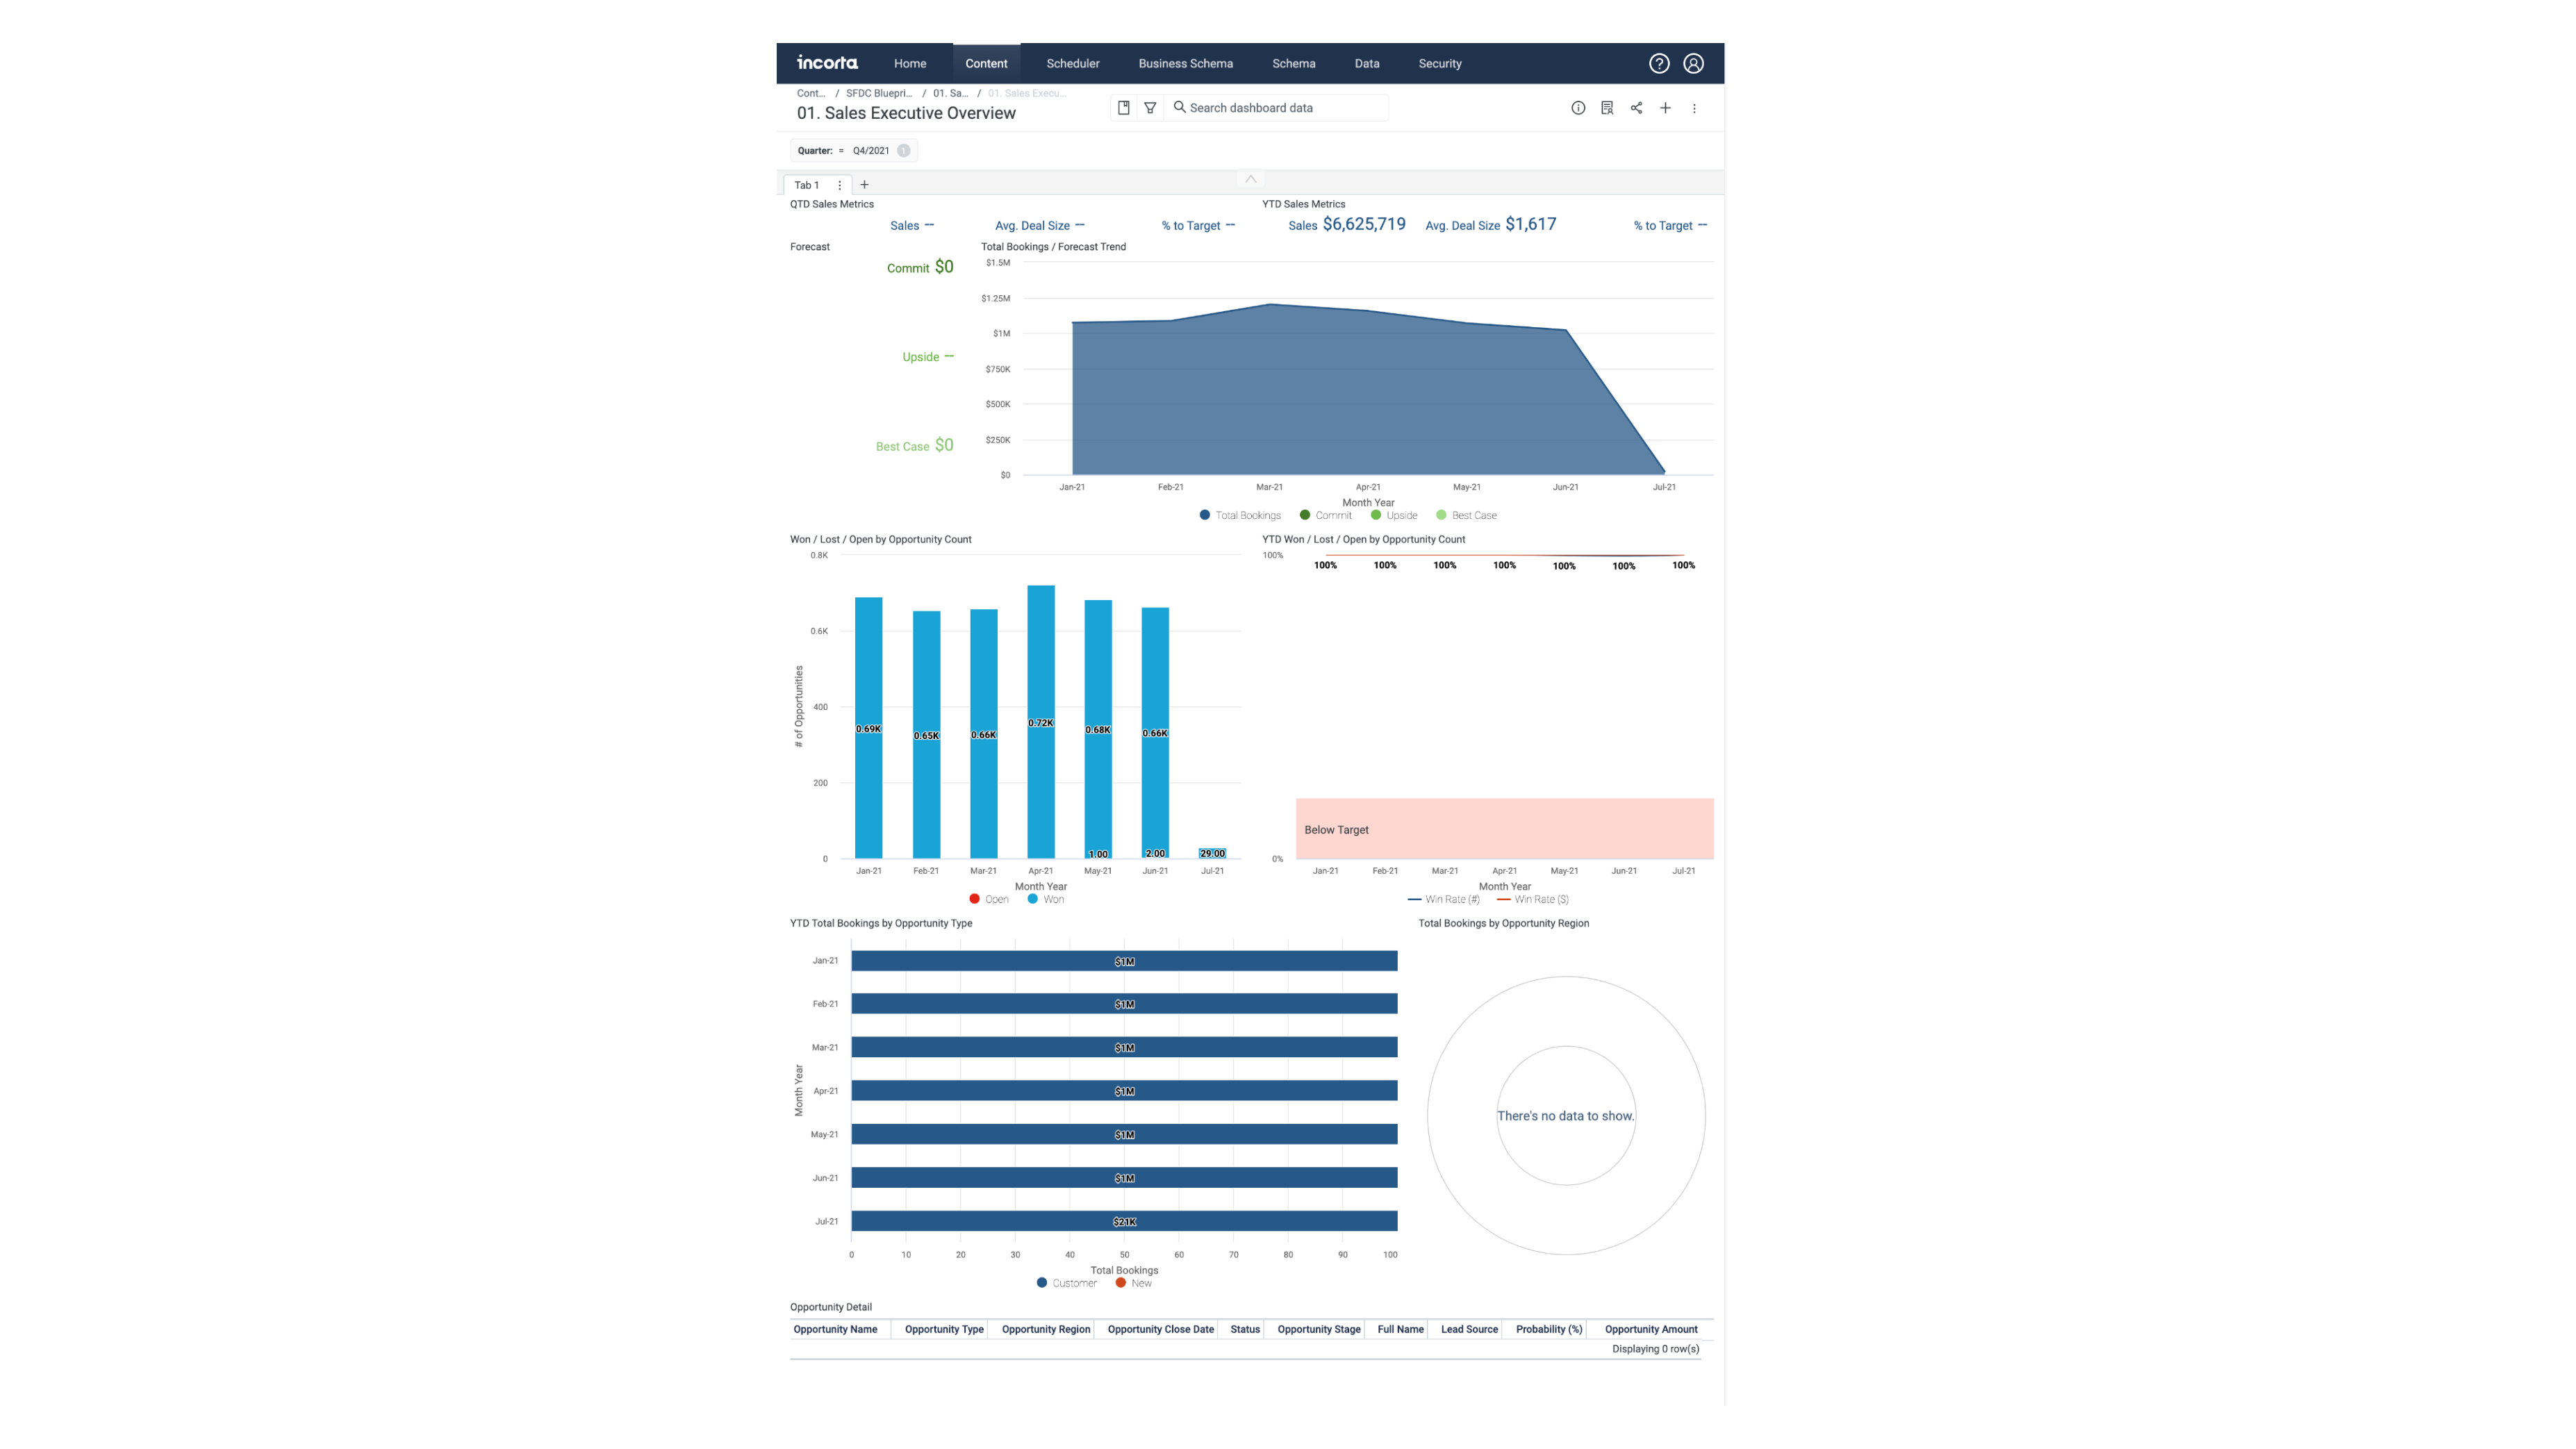
Sales Executive Overview
The following table shows the sales executive overview insights.
| Insight | Description |
|---|---|
| QTD Sales Metrics | This KPI insight shows the sum of sales and its percent of target in the quarter you select |
| YTD Sales Metrics | This KPI insight shows the sum of sales and its percent of target from a specific year to date |
| Forecast | This KPI insight shows the forecast amount for potential sales |
| Total Bookings / Forecast Trend | This stacked area insight shows the total number of bookings in a specific month of the year |
| Won / Lost / Open by Opportunity Count | This stacked column insight shows the number of won and lost opportunities in a specific month of the year |
| YTD Won / Lost / Open by Opportunity Count | This combo insight shows the win rate in a specific month of the year compared to the target |
| YTD Total Bookings by Opportunity Type | This percent bar insight shows the total bookings value together with the type of the opportunity (customer, new logo) in a specific month of the year |
| Total Bookings by Opportunity Region | This donut insight shows the lead source and the total bookings value by opportunity region |
| Opportunity Detail | This listing table insight shows the header details, including: opportunity name, opportunity type, opportunity region, opportunity close date, status, opportunity stage, full name, lead source, probability(%), and opportunity amount |
Pipeline Analysis
The following table shows the pipeline analysis insights.
| Insight | Description |
|---|---|
| Pipeline Metrics | This KPI insight shows the number of opportunities in the quarter you select |
| Open Opportunities | This KPI insight shows the number of open opportunities in qualification, evaluation, and closing in the quarter you select |
| Pipeline by Closing Date | This stacked column insight shows the open opportunities by stage and closing date |
| Sales Funnel | This funnel insight shows the opportunity count per stage |
| Top 10 Accounts with Open Opportunities | This stacked bar insight shows the top ten accounts with the highest number of open opportunities |
| Open Opportunity Amount by Location | This map insight shows the open opportunity amount by location |
| Opportunity Share | This aggregated table insight shows the number of opportunities and their amounts for each industry |
| Opportunity Stage Velocity (NewBusiness) | This stacked bar insight shows the average number of days an opportunity in a given stage spent in the preceding stages. Select an opportunity stage to view opportunity-level detail. |
| Strike Zone | This heatmap insight shows the number of opportunities won by both opportunity amount and opportunity age |
| Opportunity Detail | This aggregated table insight shows the header details, including: opportunity name, opportunity type, opportunity region, close date, status, opportunity stage, full name, lead source, probability(%), and opportunity amount |

Sales Performance and Coaching
The following table shows the sales performance and coaching insights.
| Insight | Description |
|---|---|
| KPIs | This KPI insight shows the number of open opportunities, total pipeline, forecast, and the number of activities in the previous week in the quarter you select |
| This KPI insight shows the sales percentage compared to the target, the number and value of the win rate in the quarter you select | |
| YTD Top 10 Account Managers | This combo dual axis insight shows the top ten account managers with the highest number of total bookings and number of sales activities year to date |
| YTD Bottom 10 Account Managers | This combo dual axis insight shows the bottom ten account managers with the lowest number of total bookings and number of sales activities year to date |
| Actuals vs Target by Sales Rep | This aggregated table insight shows details about the total bookings value and percentage vs the target per sales representative |
| Total Bookings by Opportunity Type | This donut insight shows the total bookings by opportunity type (customer, new logo) |
| Open Opportunities by Rep and Age Bucket | This stacked column insight shows the count of open opportunities by sales representatives. It shows buckets for days that have elapsed from the opportunity creation date for the entire calendar year of the selected quarter |
| Opportunities Past Due by Rep (Current Quarter) | This aggregated table insight shows opportunities past due by sales representative in the current quarter |
| Opportunity Detail | This listing table insight shows the header details, including: opportunity name, opportunity region, opportunity close date, status, opportunity stage, full name, lead source, probability(%), and opportunity amount |

Opportunity History
The following table shows the opportunity history insights.
| Insight | Description |
|---|---|
| Average Opportunity Velocity | This KPI insight shows the average opportunity velocity in terms of discovery, demo, poc, negotiation, redlining, and closure status |
| Average Velocity by Opportunity Status | This stacked bar insight shows the opportunities stages versus their status |
| Average Velocity by Opportunity Stage | This stacked bar insight shows the average number of days an opportunity in a given stage spent in the preceding stages. Select an opportunity stage to view opportunity-level detail. |
| # of Opportunities in Each Stage | This stacked column insight shows the number of opportunities per stage |
| Opportunity Conversion Funnel | This funnel insight shows the opportunity count per stage |
| Opportunity History Information | This listing table insight shows the header details, including: opportunity name, opportunity stage, opportunity type, and stage |
| History Detail | This listing table insight shows the header details, including: account name, opportunity name, close date, created by ID, created date, deleted, opportunity history ID, stage name, system modstamp, forecast category, probability, amount, and expected revenue |

Opportunity Detail
The following table shows the opportunity detail insights.
| Insight | Description |
|---|---|
| NewBusinessDetails | This listing table insight shows the header details, including: opportunity ID, account name, opportunity name, industry, region, close date, created date, closed, won, closing quarter, forecast category, opportunity stage, probability(%), forecast, opportunity amount |
| UpsellRenewal Details | This listing table insight shows the header details, including: account name, opportunity name, industry, region, close date, created date, closed, won, closing quarter, forecast category, opportunity stage, probability(%), forecast, opportunity amount |
