References → Classification & Masking KPIs Report (Preview)
The Classification & Masking KPIs Report is a dashboard that provides visibility into how data assets are classified and masked across your environment. The dashboard is organized into two sections: Data Classification and Data Masking.
Starting 2026.5.0:
- The Data Classification KPIs V1 report has been renamed to Classification & Masking KPIs.
- You must update the
Catalog Overview Assetspackage as the previous Data Classification KPIs V1 report is no longer compatible. - All KPIs and insights reflect the latest version of the report and are scoped to the current tenant only.
- Existing installations must re-import the related schemas, business schemas, and dashboards, thrn reload the load plan to ensure accurate results. For more information, refer to the Data Catalog Package Installation and Configuration Guide.
Classification & Masking KPIs Dashboard Overview
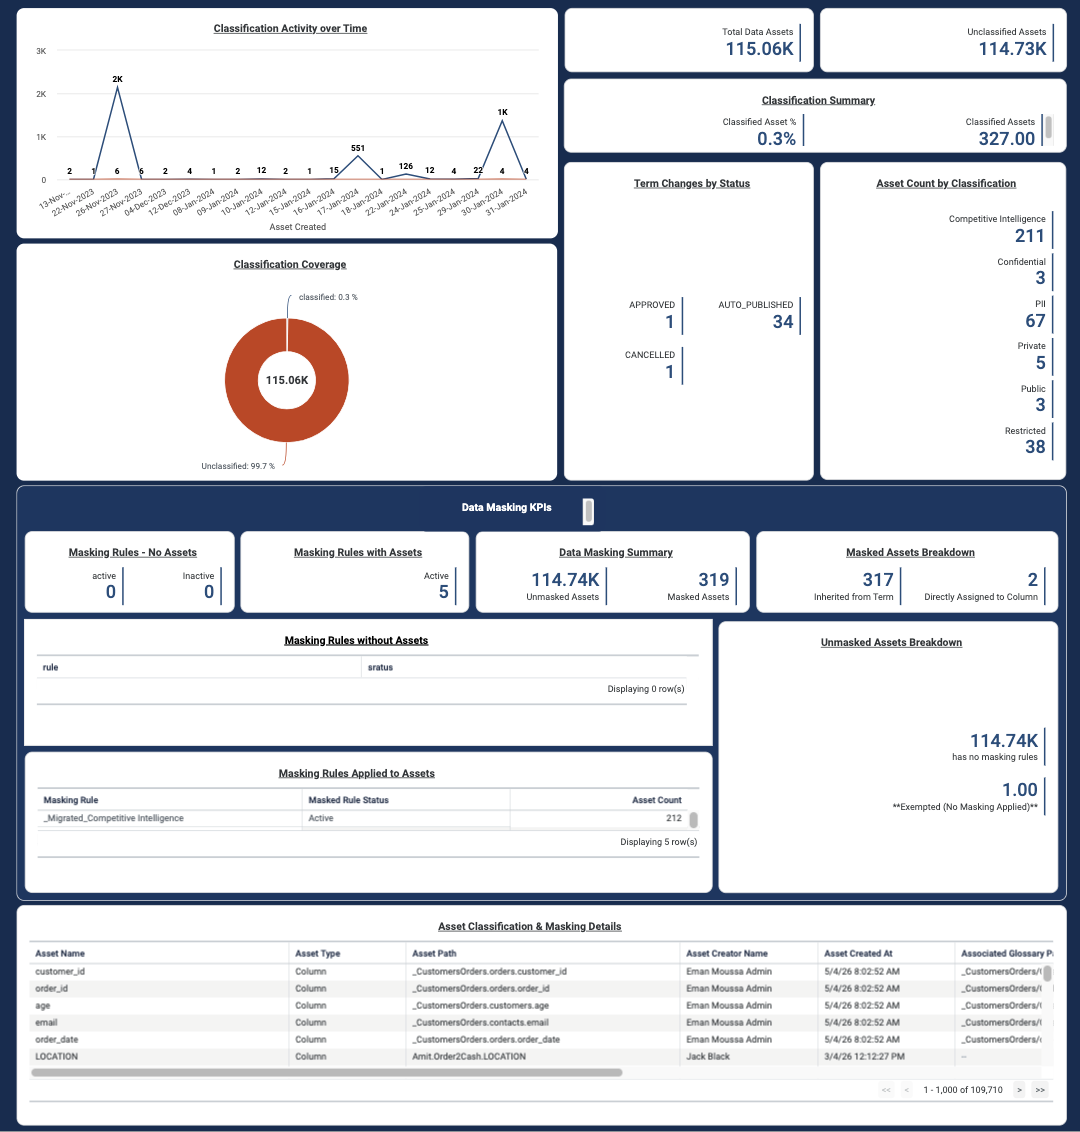
Data Classification
Monitor classification coverage of your data assets across the catalog through the Classification & Masking KPIs dashboard. Key metrics include the total number of data assets, counts of classified and unclassified assets, and the overall percentage of classified assets.
Classification KPIs
Use the dashboard to answer data classification questions, such as:
How many of my data assets are classified?
How is classification progressing over time?
The following table describes the available insights:
| Insight | Type | Description |
|---|---|---|
| Classification Activity over Time (Previously: Data Classification with Time) | Line Time Series chart | Tracks total assets and classified assets by creation date to visualize classification progress over time. Note: Starting 2026.5.0, the chart is sorted in ascending order by asset creation date. |
| Total Data Assets (Previously: Number of Assets) | KPI | Displays the total number of data assets within the current tenant scope. |
| Unclassified Assets | KPI | Displays the number of assets that have not yet been assigned a classification type. |
| Classification Summary | KPI | Displays the percentage of classified assets alongside the raw classified assets. |
| Classification Coverage (Previously: Data Classification with Assets) | Donut chart | Shows the proportion of classified versus unclassified assets. |
| Asset Count by Classification (Previously: Classification Types) | KPI | Displays classification types and the number of assets assigned to each type. |
| Term Changes by Status (Previously: Classified Workflow Types) | KPI | Displays glossary term changes by workflow status, such as Pending Review, Approved, Auto-Published, or Cancelled by Admin. |
Data Masking
Monitor masking coverage of your data assets across the catalog through the Classification & Masking KPIs dashboard. Key metrics include the number of masked versus unmasked assets, masking rule usage across assets, and whether masking is inherited through glossary terms or directly assigned at the column level.
Data Masking KPIs
Use the dashboard to answer data masking questions, such as:
Which classified assets are actually masked?
Where are the masking gaps?
Are all masking rules in active use?
Data Masking KPIs are available starting 2026.5.0.
The following table describes the available insights:
| Insight | Type | Description |
|---|---|---|
| Masking Rules - No Assets | KPI | Displays the count of active and inactive masking rules that are not currently applied to any asset. |
| Masking Rules with Assets | KPI | Displays the count of active and inactive masking rules currently applied to at least one asset. |
| Data Masking Summary | KPI | Displays the total number of masked versus unmasked assets based on active masking rule assignments. |
| Masked Assets Breakdown | KPI | Shows whether masking was inherited from a glossary term or directly assigned at the column level. |
| Masking Rules without Assets | Listing Table | Lists masking rules that exist but are not currently linked to any asset. |
| Masking Rules Applied to Assets | Aggregated Table | Lists masking rules currently applied to assets, including rule status and covered asset count. |
| Unmasked Assets Breakdown | KPI | Categorizes unmasked assets by reason, such as exempted (no masking applied), inactive rules, or no rule assignment. |
| Asset Classification & Masking Details | Listing Table | Displays details of column-level assets, including classification type, masking rule, masking status, and workflow details. |
Limitations
- When a masking rule is assigned to a glossary term with no linked columns, the rule does not appear in the Masking Rules without Assets insight or on the dashboard. As a result, active and inactive masking rule totals may be inaccurate.
- Workaround: Ensure all terms associated with Masking Rules have at least one linked column, or verify rule assignments directly from Data Governance → Masking Rules.