Tools → CMC Monitor
CMC Monitor Overview
The Cluster Management Console (CMC) Monitor enables you to view utilization graphs and insights per cluster, such as virtual memory usage, queued or running jobs, and so on. The monitoring tool enables you to filter the insights you need to view for nodes, infrastructure, and tenants in this cluster.
CMC Monitoring Access Rights
Only a CMC administrator can view the utilization by selecting the Monitoring tab in the navigation bar of the CMC.
CMC Monitoring Anatomy
The CMC Monitoring consists of the following:
Search Bar
The search bar consists of the following that you can use to filter the displayed utilization insights:
| Control | Type | Description |
|---|---|---|
| Timezone | drop down list | Select the appropriate time zone for either the client or the server. The default time zone is the client’s time zone. If the server and client time zones are the same, the label will be Server/Client Timezone. |
| Date | calendar | Specify a start and end date, with a maximum range of five days. The default date range is the last five days including the current day. |
| Cluster Name | drop down list | Select a cluster name. The default value is the first cluster. |
Context Bar
The context bar consists of three tabs:
- Nodes tab, which contains all nodes and services related monitored data
- Infrastructure tab, which contains all infrastructure related monitored data, such as metadata database, Zookeeper, Spark, and Notebook data
- Tenants tab, which contains all tenant(s) related monitored data
- Range Selector, which specifies the time or date intervals of data to show in the monitored graphs. It can be one of the following values:
- One hour
- Three hours (default)
- Five hours
- Custom (maximum five days interval)
- Reload, which reloads the monitored data to get the latest
Dashboard view
The dashboard view for each of the available tabs differs from one tab to another. Each view contains different insights for the data monitored, and each insight has a legend that is clickable to hide or show the corresponding data.
Nodes dashboard
The Nodes tab contains a collapsible panel for each node in a cluster, and each panel contains a collapsible panel for each of the contained services.
Starting with the Incorta Cloud 2022.3.0 release, Incorta introduced three new utilizaiton charts in the Node tab: Diskspace, Ram usage, and Real Memory.
Each node collapsible panel contains:
- Diskspace %, which tracks the percentage of the consumed virtual disk space
- Ram Usage, which tracks the RAM usage of the virtual memory and service status change events

Each service collapsible panel contain the following:
- Service Status, which tracks the loader or analytics service status over time
- Virtual Memory, which tracks the on-heap or off-heap memory, display load jobs, and dashboard rendering and service status updates
- Real Memory (GB), which tracks the value of the real memory consumed

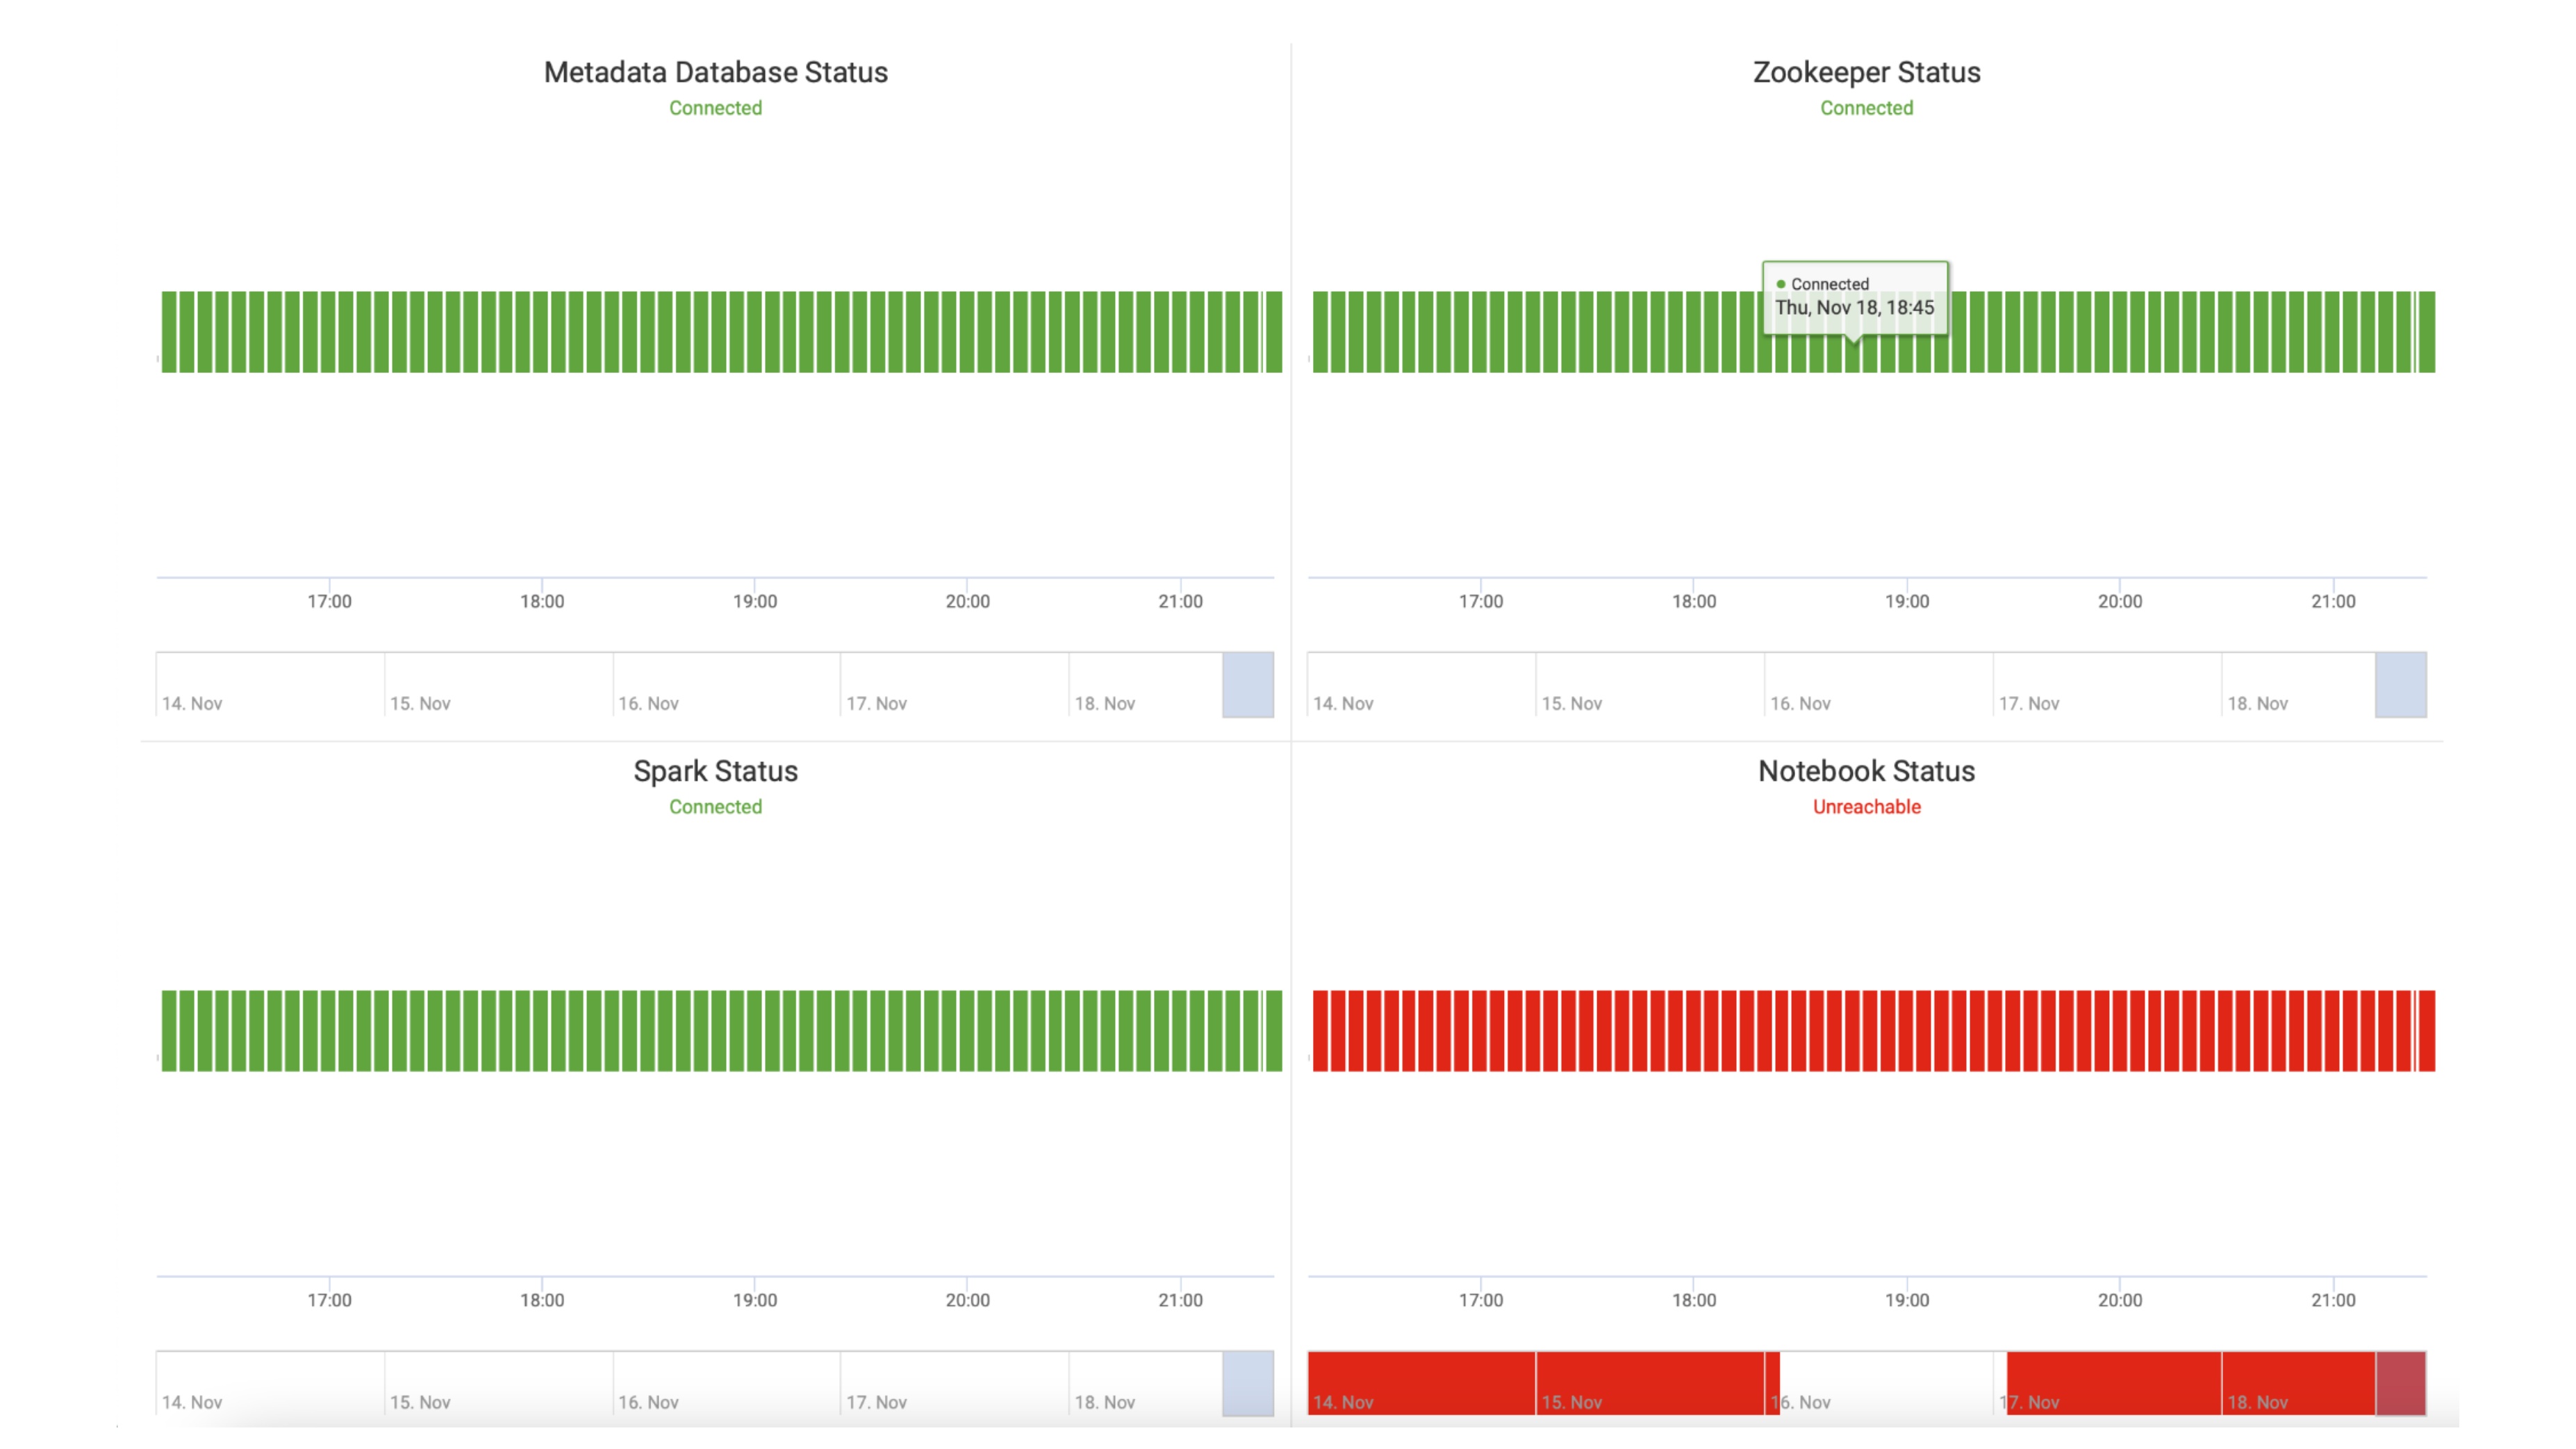
Infrastructure dashboard
The Infrastructure tab contains the following utilization insights:
- Metadata Database Status (Connected/Unreachable)
- Zookeeper Status (Connected/Unreachable)
- Spark Status (Connected/Unreachable)
- Notebook Status (Connected/Unreachable)
Tenants dashboard
The Tenants tab contains a collapsible panel for each tenant in a cluster, and each panel contains the following data utilization insights:
- Shared Directory Disk Space, which tracks the total and consumed disk space of the tenant shared directory
- Queued Load Jobs, which tracks the number of queued jobs
- Running Load Jobs, which tracks the number of running jobsNote
Jobs queued or running for less than five minutes might not be captured in the dashboard since the heartbeat period in the CMC is five minutes.

CMC Monitor Actions
For all of the available graphs that have a legend and when selecting a legend label, the graph is filtered to view only the data related to the selected legend.
Upon hovering on any point of the graph, the point shows a specific job that happened during that time along with its details.
Using the CMC Monitor, you can also perform the following actions:
Filter data
In any of the tabs, you can filter the monitored data displayed in the insights using one or all of the filtration options in the Search bar.
Select a timezone for the server or the client
Select a date range.
NoteThe date range cannot be more than the last five days prior to the current date.
- Choose a cluster.
- Upon selecting any of the filtration, the insight refreshes to reflect the filtration results.
Reload data
You can reload the latest monitored data using the Reload button in the Search bar.
Adjust Range Selector
You can also focus on the monitored data for a certain duration using the range selector. The range selector affects all insights in the Tenants and Nodes tabs:
- Select the 1h button to show the monitored data for the last hour
- Select the 3h button to show the monitored data for the last three hours (Selected by default)
- Select the 5h button to show the monitored data for the last five hours
- Select the Custom to select a date range within the last five days
The range selector does not affect the Infrastructure tab.
Insight actions
When you hover on a utilization graph, the details for a data point in the insight show up.
The details differ from one insight to the other. Below is a table that illustrates what details are shown.
| Tab name | Chart Name | Details |
|---|---|---|
| Nodes | Diskspace% | ● Total diskspace in GB ● Consumed diskspace in GB ● Date |
| Ram Usage% | ● Events, which show service status change at a certain point of time ● Machine Memory (GB), which shows the total memory consumed at a certain point of time | |
| Service Status | Service status, which can be one of the following values: ● Started ● Stopped ● Starting Date | |
| Virtual Memory | For the heap memory lines: ● On-heap percentage ● Active off-heap percentage ● Pooled off-heap percentage ● Date | |
| Real Memory | For Real Memory, the details are: ● The GBs consumed at this point ● Date | |
| Infrastructure | Metadata Database | ● Connected ● Unreachable ● Date |
| Zookeeper | ● Connected ● Unreachable ● Date | |
| Spark | ● Connected ● Unreachable ● Date | |
| Notebook | ● Connected ● Unreachable ● Date | |
| Tenants | Shared Directory Diskspace | ● Total disk space in GB ● Consumed disk space in GB ● Date |
| Queued Load Jobs | ● Number of queued jobs ● Date | |
| Running Load Jobs | ● Number of running jobs ● Date |