Built-in Functions → Aggregation Functions
Aggregation functions are used to summarize the data in a column. Applying them returns a single value. For example, min returns the smallest value in a column.
Functions Operating on Numeric Scalars in a Column
The functions in this table operate on numeric scalars. The only allowed type is double.
| Function | Signature | Description |
|---|---|---|
| average() | average(double[] exp) | Compute the average in a column |
| median() | median(double[] exp) | Find the median in a column |
| min() | min(double[] exp) | Find the minimum value in a column |
| max() | max(double[] exp) | Find the maximum value in a column |
| sum() | sum(double[] exp) | Find the sum of the values in a column |
| sum() | sum(double[] exp, groupBy) | Find the sum of values for each group |
Functions Counting Items of Any Type in a Column
The functions in this table operate on any Incorta data type. For this table, "<item>" stands for any Incorta data type.
| Function | Signature | Description |
|---|---|---|
| count() | count(<item>) | Returns the number of elements in a column |
| distinct() | distinct(<item>) | Returns the number of distinct groups of elements in a column |
Aggregation with a Level Based Measure
Aggregation functions can take, as a second argument, the groupBy parameter. This is an optional parameter and is valuable when creating a Level based measure.
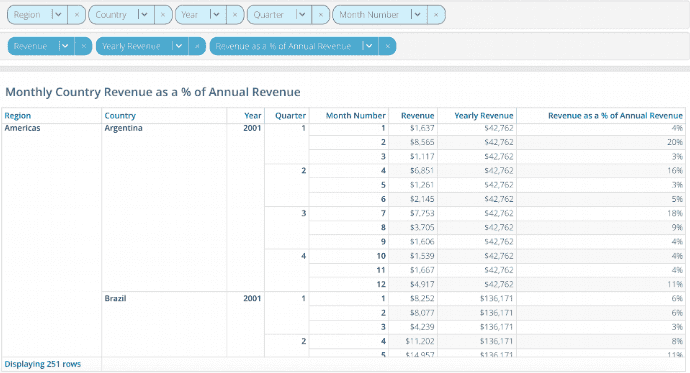
In the example below, the user wants to create an Insight to show the percentage contribution of monthly revenue to annual revenue by country and region.
To do this, the user needs to create two derived formula columns:
- Yearly Revenue, a measure aggregated at a higher level than the monthly grain and repeated for each of the monthly grain data values.
- Revenue at the monthly grain/Yearly Revenue
Note the sequence of the groupBy dimensions in the formula is important and should match the sequence of grouping dimensions in the insight. In the insight above you will see Region, Country and then Year in the grouping dimension tray.

