Data Applications → Analyze NetSuite Finance
About the Incorta Data Application for NetSuite Finance
The Incorta data application for NetSuite Finance provides prebuilt schemas, dashboards, and insights to help you manage cash, optimize payment timing for maximum benefit, and even help to identify problematic vendors.
Here are some of the questions answered by the Incorta data application for NetSuite Finance:
- Are payments to key vendors overdue?
- What are the payment discounts received?
- Which customers have the highest invoice amounts past due?
- Which countries have the highest order backlog amounts?
- Do you pay vendors too early, too late, or on time?
- How efficiently do you process payables?
- Which sales reps generate the most revenue?
- Who are the top customers by revenue amount?
You can further customize and add on to the insights in the Incorta data application for NetSuite Finance to support your specific business needs.
Finance Data Application Components
Here are the prebuilt physical schemas, business schemas, dashboard folders, dashboards, and insights the Incorta data application for NetSuite Finance uses:
Physical Schemas
- NS_accounting
- NS_items
- NS_entity
- NS_transactions
Business Schemas
- ns_common
- ns_finance
Dashboard Folder
- 2 - Finance
Dashboards and Insights
- 21 - Revenue Summary: Provides insight into revenue by a variety of dimensions, including customer, country, sales rep, and product item.
- 22 - AP Summary: Provides insight into accounts payable (AP) amounts, status, and aging by vendor and vendor type.
- 23 - AR Summary: Provides insight into accounts receivable (AR) amounts, status, and aging by customer and customer type.
- 24 - Booking Billing and Backlog: Provides insight into booking, billing, and backlog details by customer. It also provides insight into backlog by country, and booking and backlog by product item.
- 25 - Discount Tracking on Vendor Bills PO: Provides insight into the discounts received from vendors based on invoice payment terms.
- 26 - Income Statement: Provides an income statement and transaction details.
- 27 - Balance Sheet: Provides a balance sheet and transaction details.
- 28 - Trial Balance-General Ledger: Provides a trial balance, general ledger (GL) AR details, and GL AP details. The dashboard consists of a tab for each of these items:
- Trial Balance Tab: Provide the trial balance, or list of general ledger account and amount.
- GL AR Details Tab: Provides the GL AR accounts with invoice, payment and past due details.
- GL AP Details Tab: Provides the GL AP Accounts with invoice, payment, and past due details.
- 29 - GL Summary: Provides company core dimensions and amounts by GL account dimensions, including account, type, transaction period, and transaction type .
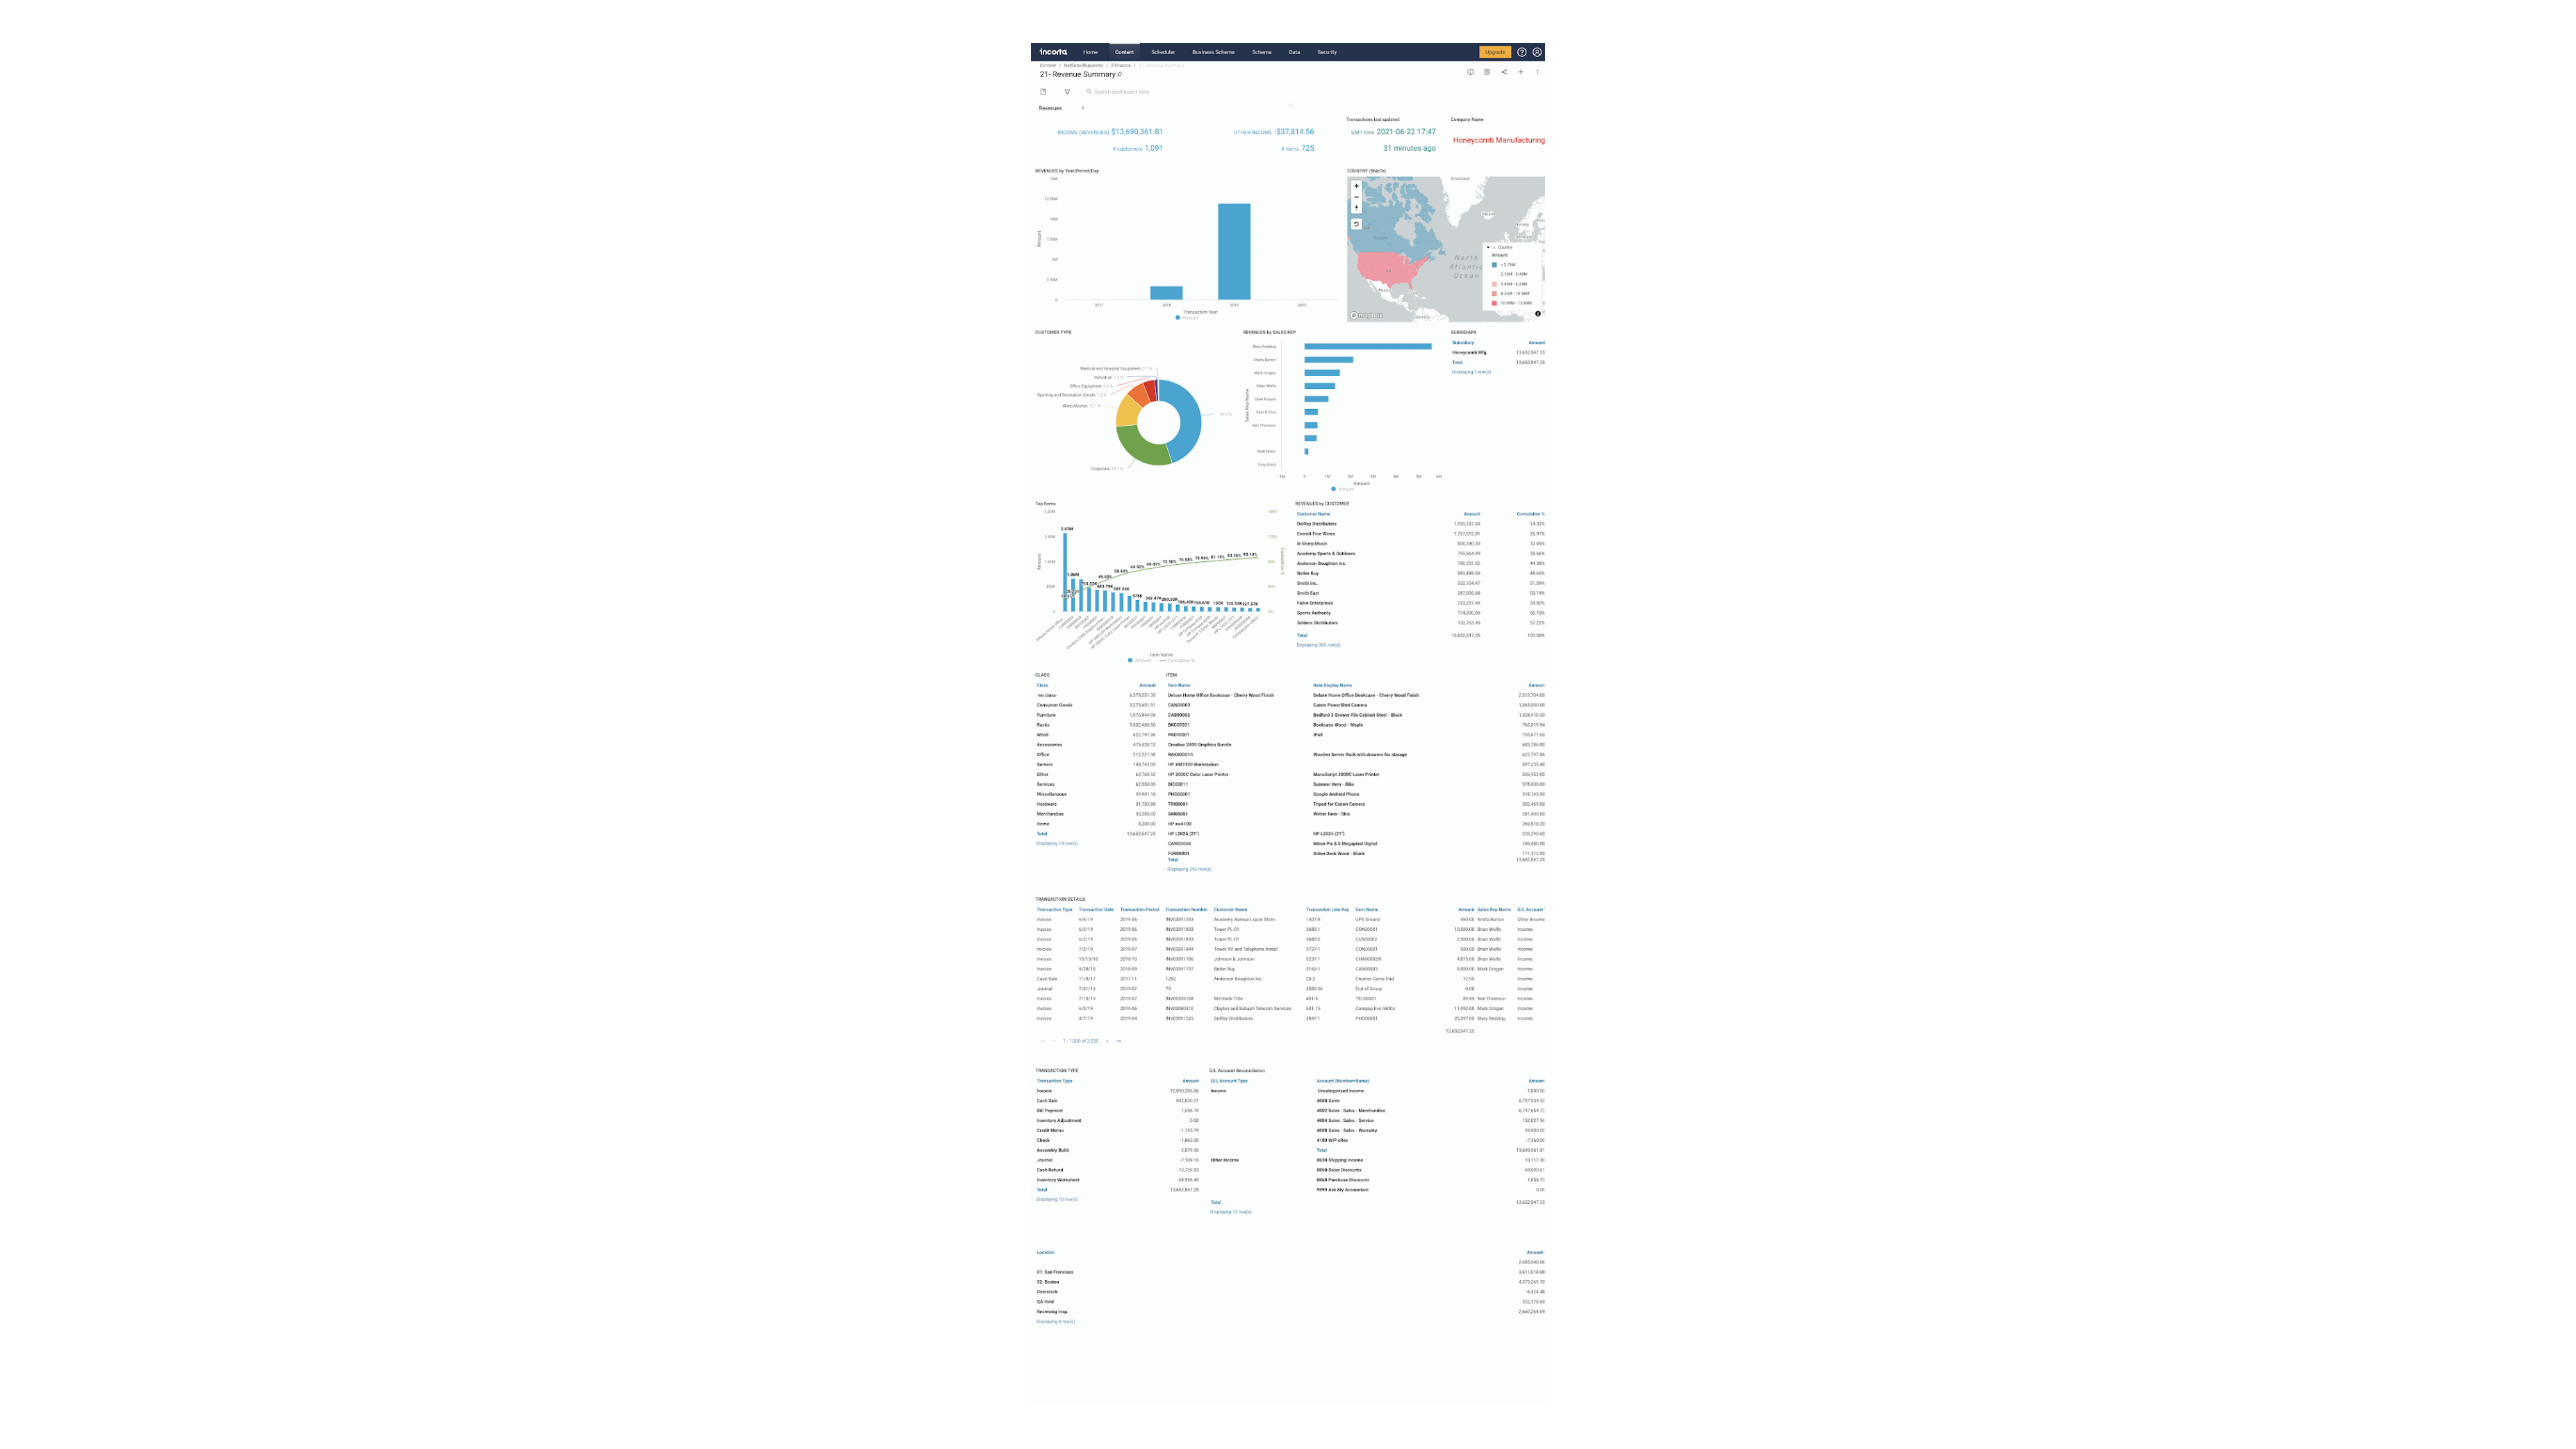
21 - Revenue Summary
Here is a description of each insight on the Revenue Summary Dashboard:
| Insight | Description |
|---|---|
| Income (Revenues) | This KPI insight shows the total income (G/L Account Type is Income) |
| Other Income | This KPI insight shows the total other income (G/L Account Type is Other Income) |
| # Customers | This KPI insight shows the number of customers |
| # Items | This KPI insight shows the number of product items |
| Transactions Last Updated | This KPI insight shows the time the transactions were last updated, and how long ago in minutes from the current time |
| Company Name | This KPI insight shows the company name |
| Revenues by Year/Period/Day | This stacked column insight shows revenue amount by transaction year, period and day. Select a year to view revenue by period, then select a period to view revenue by day. |
| Country (Ship To) | This advanced map insight shows the revenue amount by ship to country. Select the United States to view revenue by country, then select a state to view revenue by city. |
| Customer Type | This donut insight shows the revenue amount as a percent of total revenue by customer industry |
| Revenues by Sales Rep | This bar insight shows revenue amount by sales rep |
| Subsidiary | This aggregated table insight shows revenue amount by subsidiary |
| Top Items | This dual axis insight shows the top 25 product items by revenue amount, and cumulative percent of total revenue contributed by each product item |
| Revenues by Customer | This aggregated table insight shows the revenue amount by customer, and the cumulative percent of total revenue contributed by each customer |
| Class | This aggregated table insight shows the revenue amount by product class |
| Item | This aggregated table insight shows the revenue amount by product item |
| Transaction Details | This aggregated table insight shows the transaction details, including: transaction type, transaction date, transaction period, transaction number, customer name, transaction line key, item name, amount, sales rep name, G/L account type, account (number + name) |
| Transaction Type | This aggregated table insight shows revenue by transaction type |
| G/L Account Reconciliation | This aggregated table insight shows revenue by G/L account type and account (number + name) |
| Location | This aggregated table insight shows revenue by location |
Example Revenue Summary Dashboard
22 - AP Summary
Here is a description of each insight on the AP Summary Dashboard:
| Insight | Description |
|---|---|
| Total Revenue | This KPI insight shows the total revenue amount (Posting (transaction line) is True and G/L Account Type is Income, or Other Income) |
| A/P Amount | This KPI insight shows the accounts payable amount (Transaction line ID is 0 and Transaction Type is Bill, Bill Credit, or Bill Payment) |
| Open A/P Balance | This KPI insight shows the open accounts payable balance (Transaction line ID is 0 and Transaction Type is Bill, Bill Credit, or Bill Payment) |
| Past Due Amount | This KPI insight shows accounts payable past due amount (Transaction line ID is 0 and Transaction Type is Bill, Bill Credit, or Bill Payment) |
| Past Due % | This KPI insight shows the percent of accounts payable that are past due (Transaction line ID is 0 and Transaction Type is Bill, Bill Credit, or Bill Payment) |
| Vendor Type A/P Analysis | This bubble insight shows the accounts payable amount, number of invoices, and invoice amount due by vendor type |
| Top 20 Vendors by Amount & Transaction Type | This stacked column insight shows the top twenty vendors by accounts payable amount and transaction type |
| AP Detail | This listing table insight shows the accounts payable details, including: vendor type, vendor name, transaction number, status, transaction date, due date, payable amount, payments due, and payable amount due |
| AP Aging Bucket | This column insight shows the accounts payable invoice amount due by aging bucket |
Example AP Summary Dashboard

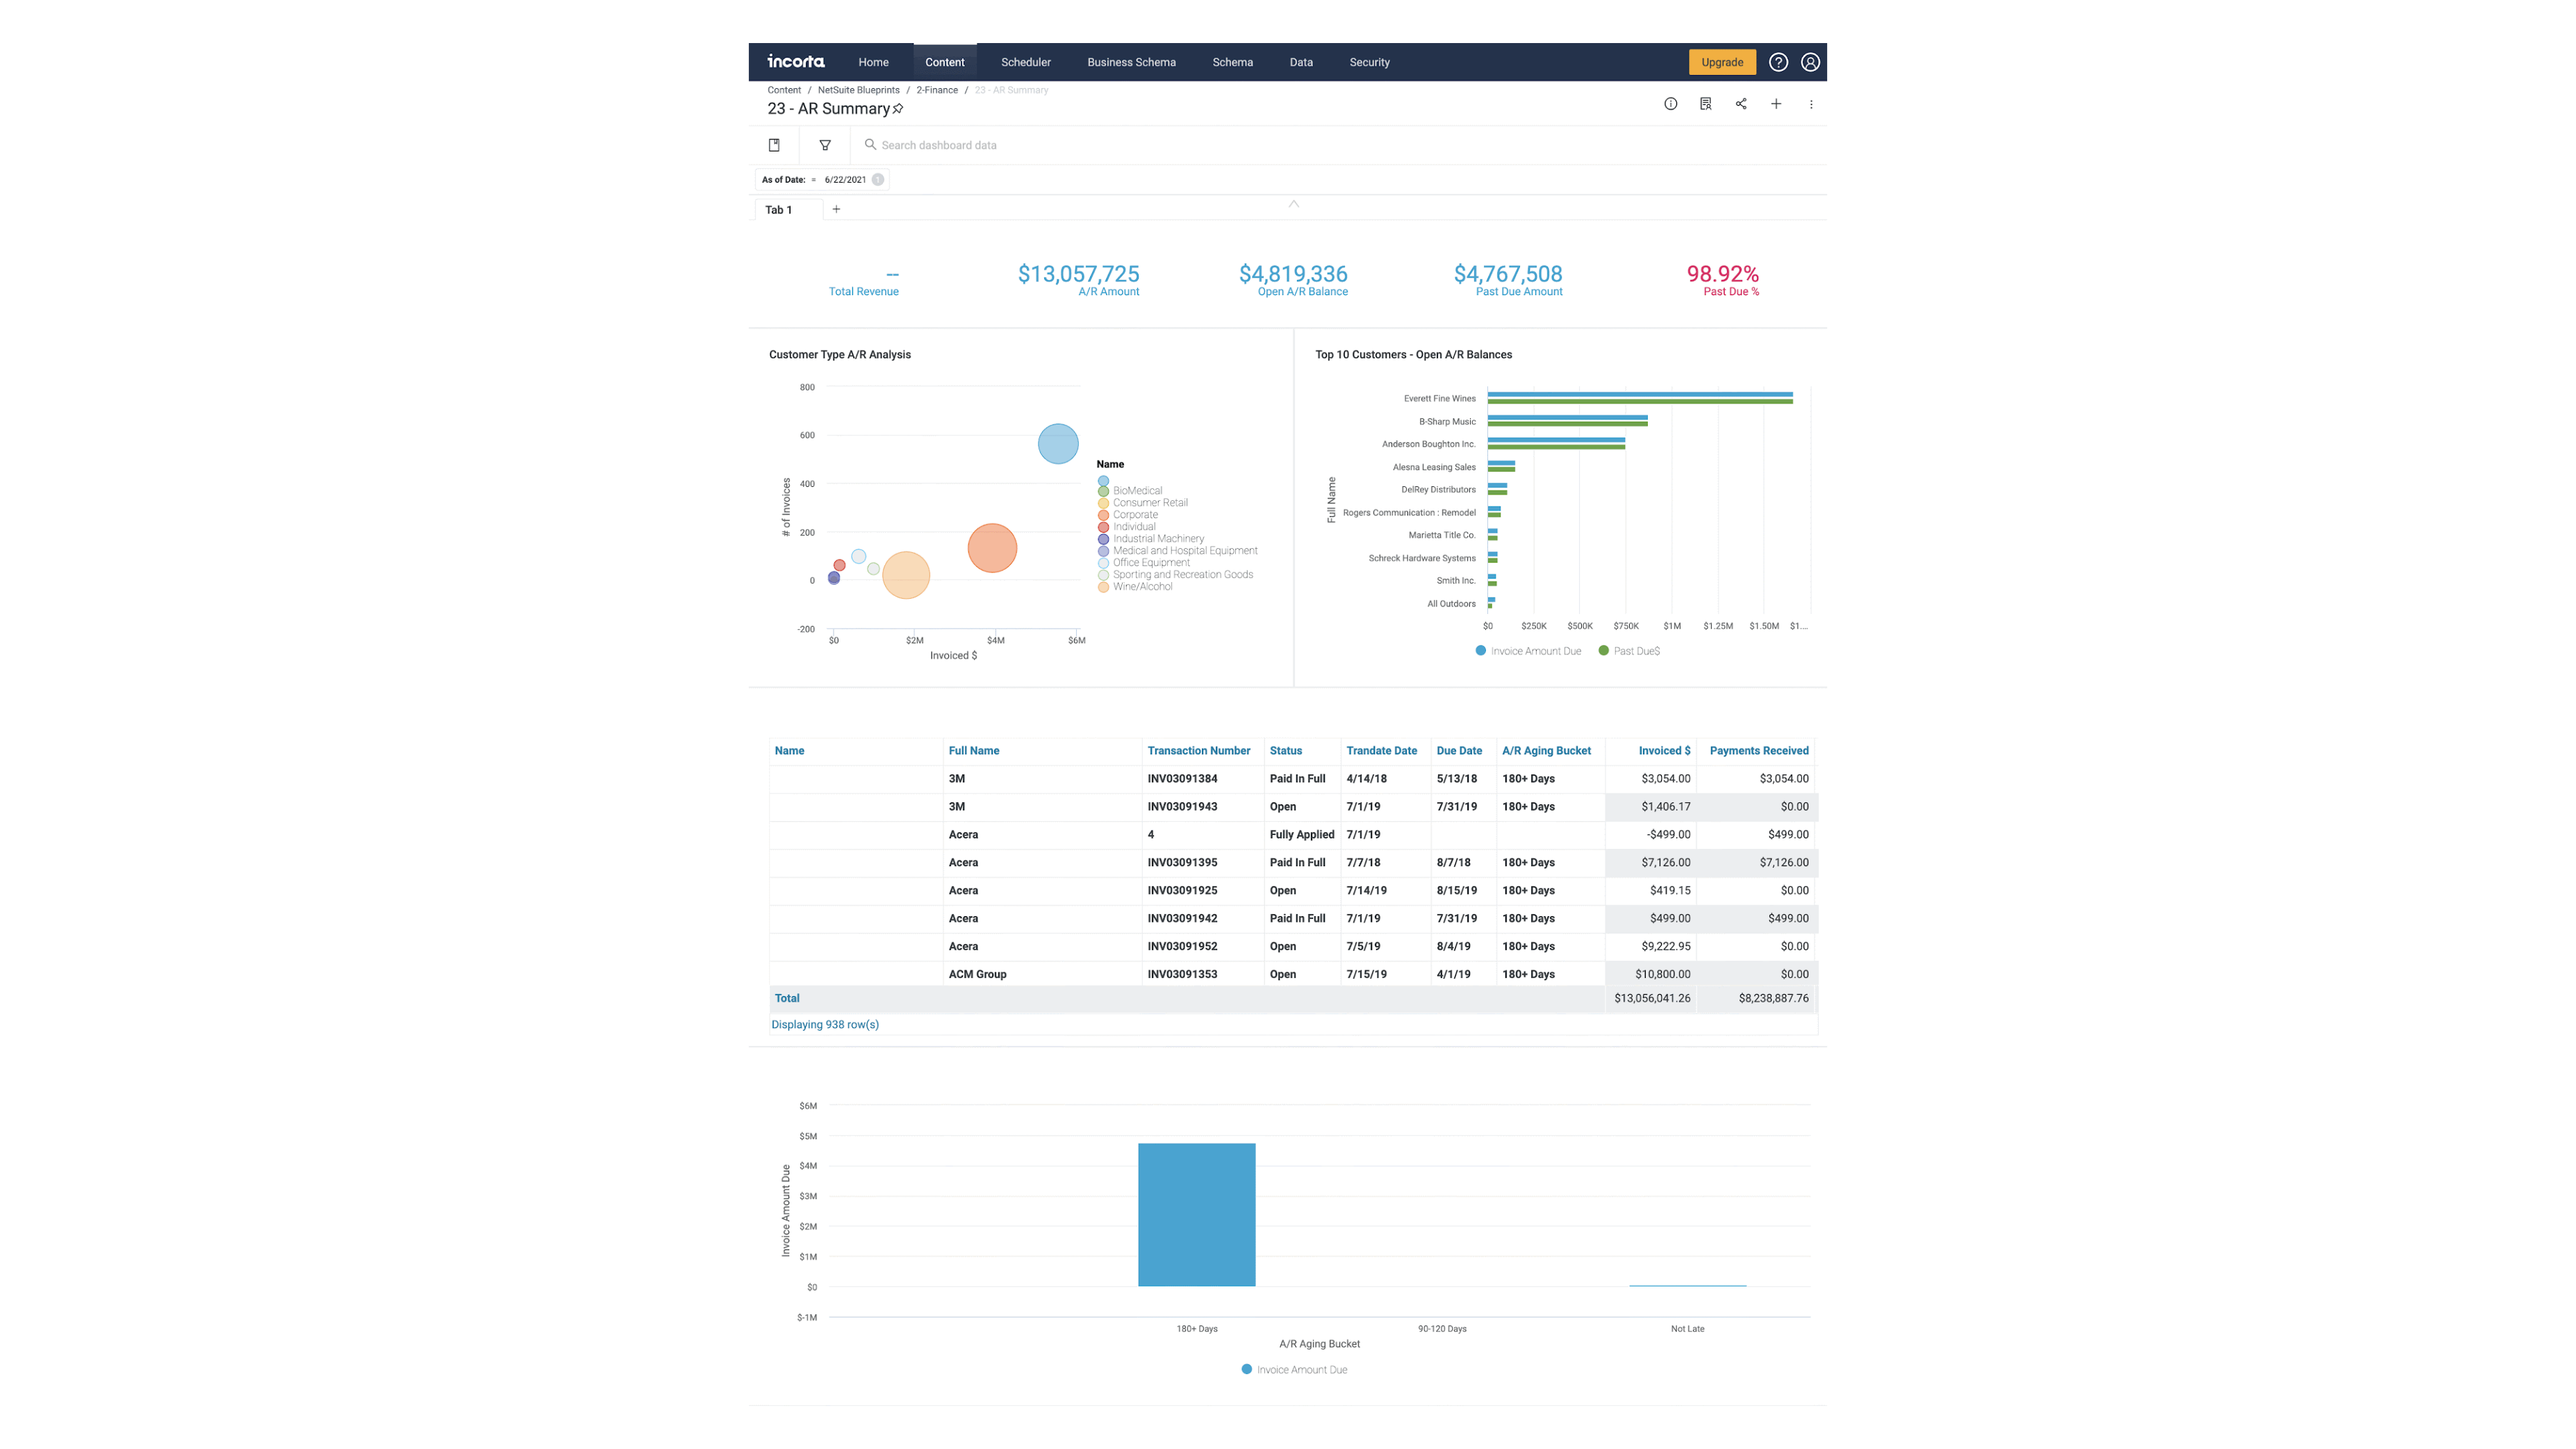
23 - AR Summary
Here is a description of each insight on the AR Summary Dashboard:
| Insight | Description |
|---|---|
| Total Revenue | This KPI insight shows the total revenue amount (Posting (transaction line) is True and G/L Account Type is Income, or Other Income) |
| A/R Amount | This KPI insight shows the accounts receivable amount (Transaction line ID is 0 and Transaction Type is Invoice) |
| Open A/R Balance | This KPI insight shows the open accounts receivable balance (Transaction line ID is 0 and Transaction Type is Invoice) |
| Past Due Amount | This KPI insight shows accounts receivable past due amount (Transaction line ID is 0 and Transaction Type is Invoice) |
| Past Due % | This KPI insight shows the percent of accounts receivable that are past due (Transaction line ID is 0 and Transaction Type is Invoice) |
| Customer Type A/R Analysis | This bubble insight shows the invoice amount, number of invoices, and invoice amount due by customer type |
| Top 10 Customers - Open A/R Balances | This bar insight shows the top ten customers by invoice amount due and past due |
| AR Detail | This listing table insight shows the accounts receivable details, including: customer name, transaction number, status, transaction date, due date, accounts receivable aging bucket, invoice amount, and payments received |
| AR Aging Bucket | This column insight shows the accounts receivable invoice amount due by aging bucket |
Example AR Summary Dashboard
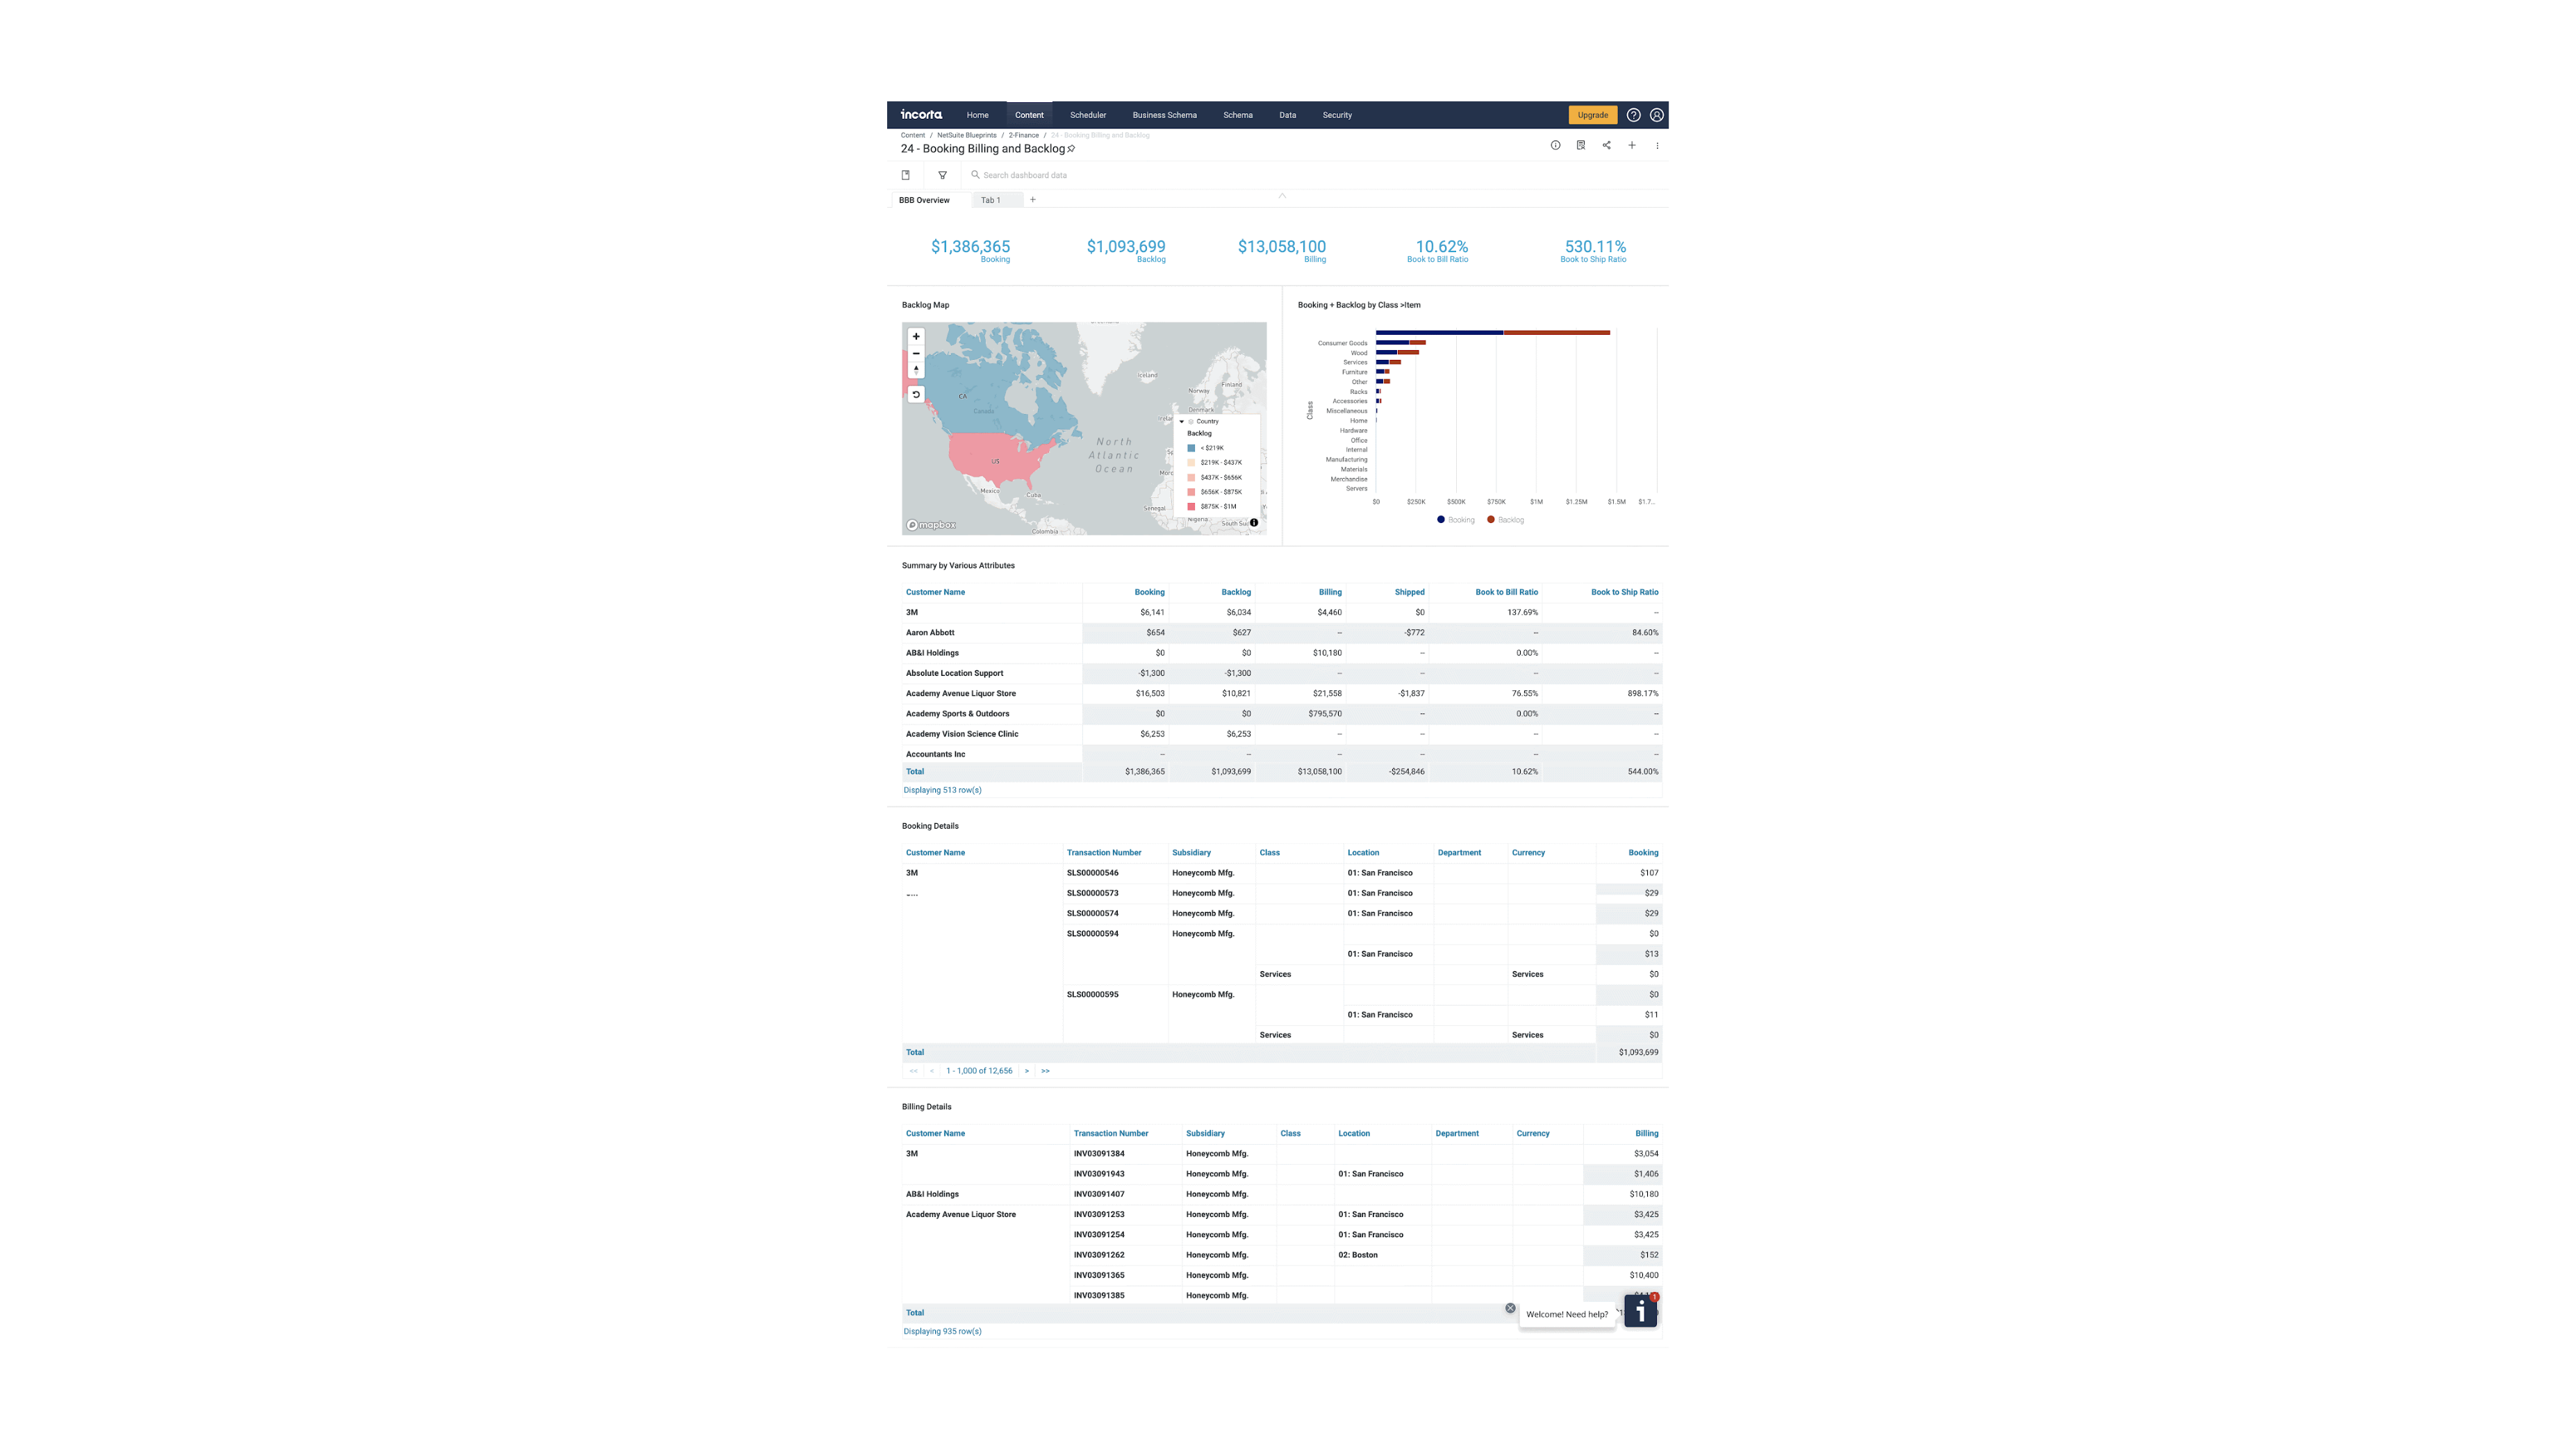
24 - Booking Billing and Backlog
Here is a description of each insight on the Booking Billing and Backlog Dashboard:
| Insight | Description |
|---|---|
| Booking | This KPI insight shows the total booking amount (Transaction line ID is 1 and Transaction Type is Sales Order) |
| Backlog | This KPI insight shows the total backlog amount (Transaction line ID is 0 and Transaction Type is Invoice, and Backlog Status is not null) |
| Billing | This KPI insight shows the total billing amount (Transaction Type is Invoice and Main Line is True) |
| Book to Bill Ratio | This KPI insight shows the booking amount divided by billing amount as a percent |
| Book to Ship Ratio | This KPI insight shows the booking amount divided by the shipped amount as a percent |
| Backlog Map | This advanced map insight shows the backlog amount by ship to country. Select the United States to view backlog by country, then select a state to view backlog by city. |
| Booking + Backlog by Class > Item | This stacked bar insight shows the booking and backlog amount by product class. Select a class to view the booking and backlog amount by product item. |
| Summary by Various Attributes | This aggregated table insight shows booking amount, backlog amount, billing amount, shipped amount, book to bill ratio, and book to ship ratio by customer |
| Booking Details | This aggregated table insight shows the booking amount by customer name, transaction number, subsidiary, class, location, department, and currency |
| Backlog Details | This aggregated table insight shows the backlog amount by customer name, transaction number, subsidiary, class, location, department, and currency |
| Billing Details | This aggregated table insight shows the billing amount by customer name, transaction number, subsidiary, class, location, department, and currency |
Example Booking Billing and Backlog Dashboard
25 - Discount Tracking on Vendor Bills PO
Here is a description of each insight on the Discount Tracking on Vendor Bills PO Dashboard:
| Insight | Description |
|---|---|
| Discount Tracking on Vendor Bills PO | This listing table insight shows the bill due date, vendor, amount, purchase order (PO) creation date, and terms |
Example Discount Tracking on Vendor Bills PO Dashboard

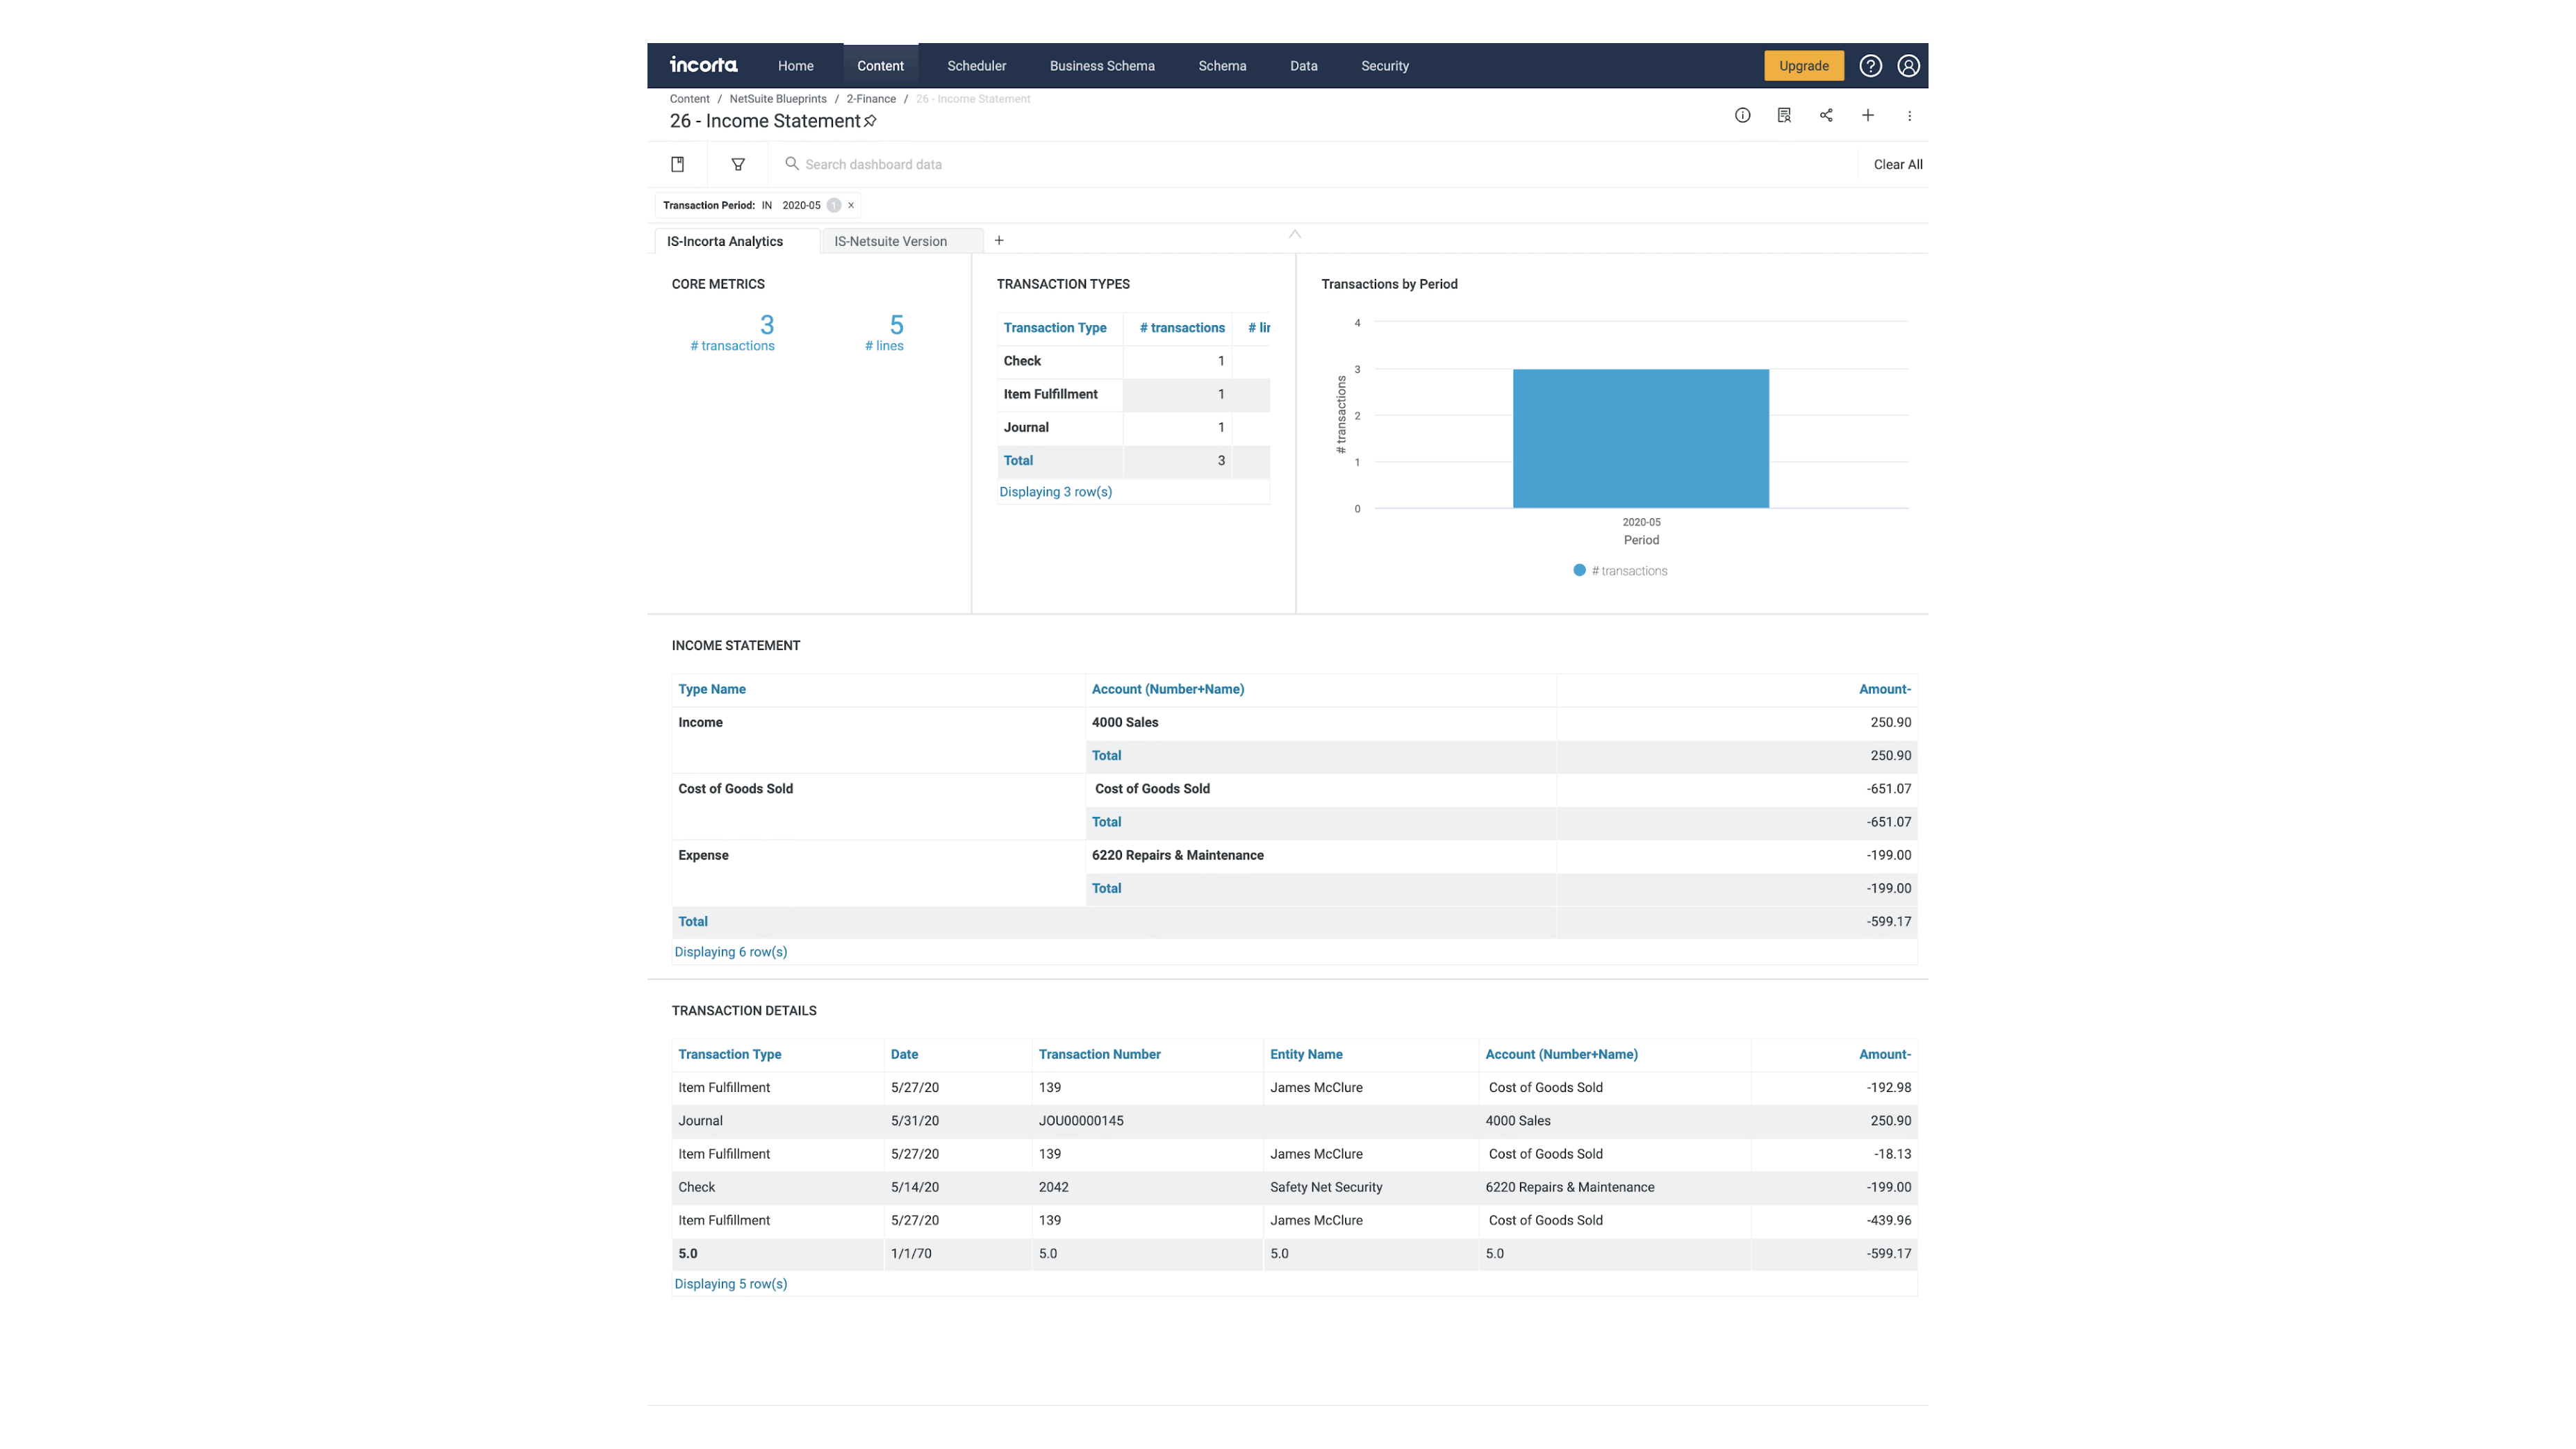
26 - Income Statement
| Insight | Description |
|---|---|
| # Transactions | This KPI insight shows the number of transactions for the period you specify |
| # Lines | This KPI insight shows the number of transaction lines for the period you specify |
| Transaction Types | This aggregated table insight shows the number of transactions and number of transaction lines by transaction type |
| Transactions by Period | This column insight shows the number of transactions by period |
| Income Statement | This aggregated table insight shows the transaction amount by account type name and account (number + name) |
| Transaction Details | This listing table insight shows the transaction details, including: transaction type, date, transaction number, entity name, account (number + name), and amount |
Example Income Statement
27 - Balance Sheet
| Insight | Description |
|---|---|
| Balance Sheet | This aggregated table insight shows the amount by financials grouping (asset or liabilities), G/L account type, and balance sheet account (number + name) |
Example Balance Sheet Dashboard

28 - Trial Balance-General Ledger
Trial Balance Tab
Here is a description of each insight on the Trial Balance tab:
| Insight | Description |
|---|---|
| Trial Balance | This aggregated table insight shows the opening balance, debit amount, credit amount, and closing balance for each general ledger account (number + name) |
Example Trial Balance Tab

GL AR Details Tab
Here is a description of each insight on the GL AR Details tab:
| Insight | Description |
|---|---|
| GL - AR Detail | This aggregated table insight shows invoiced dollar amount, payments received, invoice amount due, past due, and past due amount for each of the following levels: GL AR account (number + name), company name, transaction number, status, transaction date, due date, and AR aging bucket |
Example GL AR Details Tab

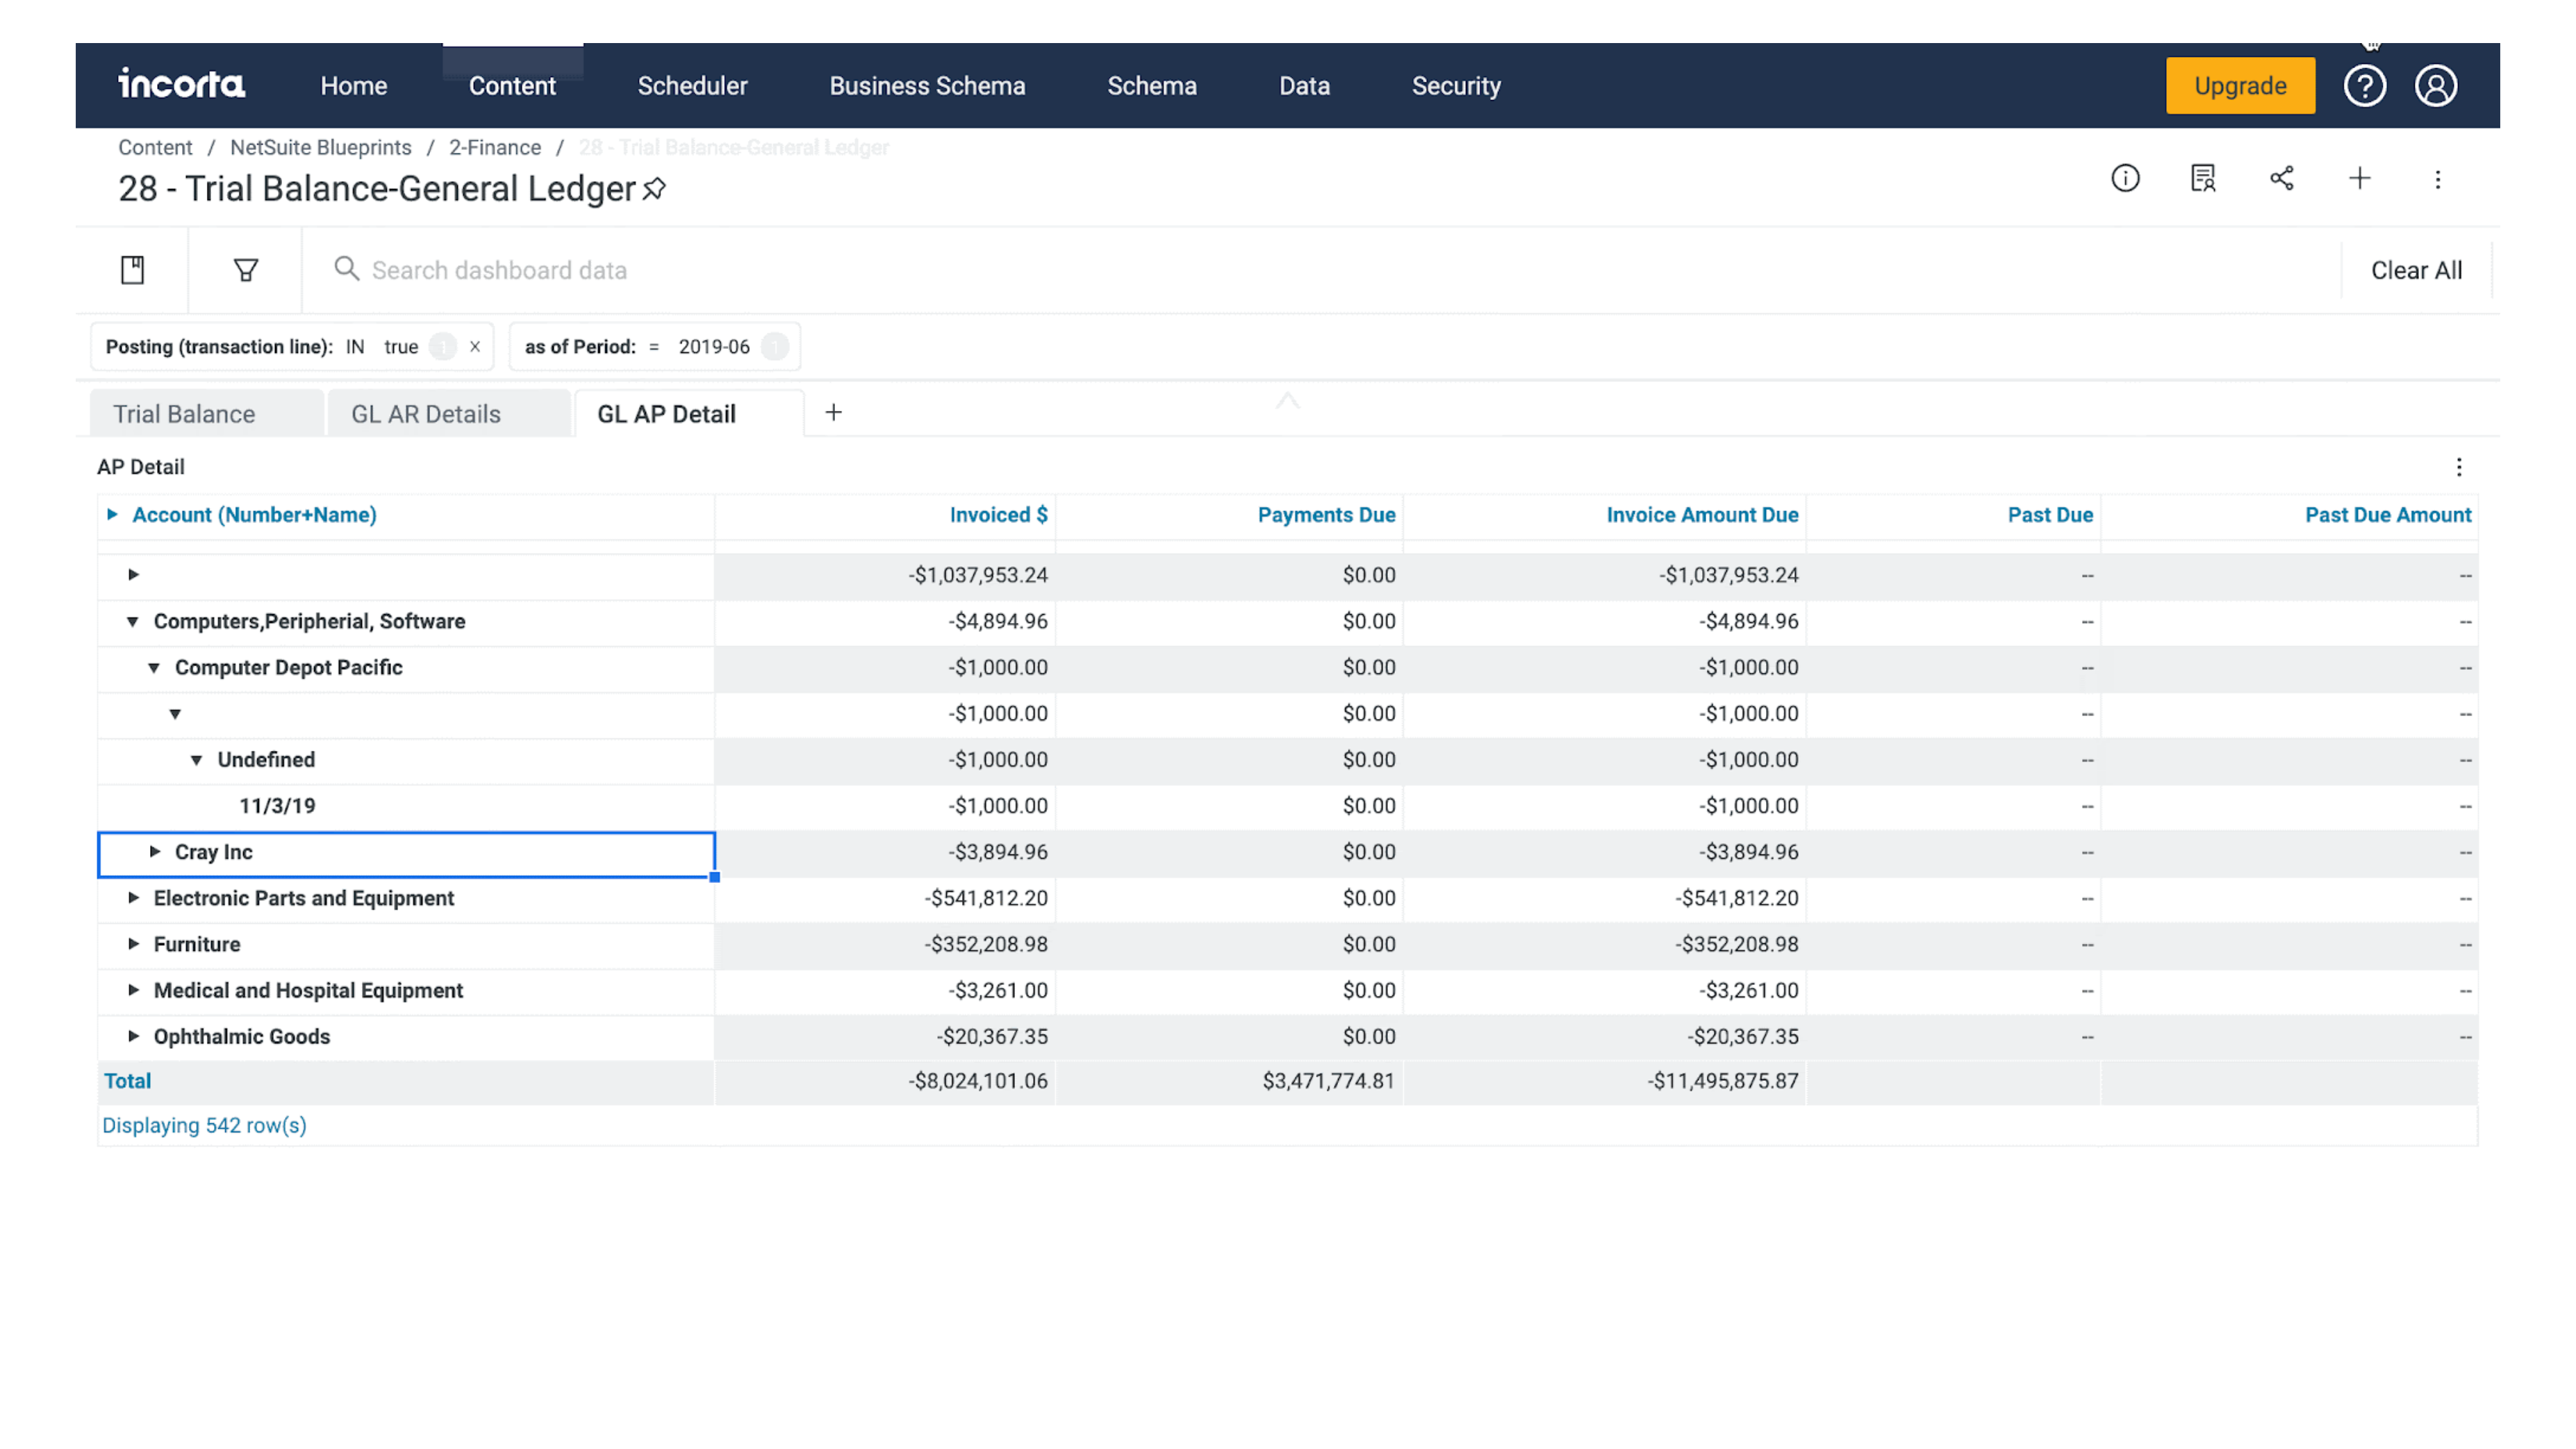
GL AP Details Tab
Here is a description of each insight on the GL AP Details tab:
| Insight | Description |
|---|---|
| GL - AP Detail | This aggregated table insight shows invoiced dollar amount, payments received, invoice amount due, past due, and past due amount for each of the following levels: GL AP account (number + name), vendor type, vendor name, transaction number, status, and transaction date |
Example GL AP Details Tab
29 - GL Summary
| Insight | Description |
|---|---|
| # Subsidiaries | This KPI insight shows the number of subsidiaries |
| # Currencies | This KPI insight shows the number of currencies |
| # G/L Accounts | This KPI insight shows the number of GL accounts |
| # Classes | This KPI insight shows the number of product classes |
| # Locations | This KPI insight shows the number of locations |
| # Departments | This KPI insight shows the number of departments |
| Amount by G/L Account Type | This treemap insight shows the transaction gross amount by GL account type |
| Gross Amount by Transaction Period & Transfer Type | This area insight shows the transaction gross amount by transaction period and transfer type |
| Transaction Type | This aggregated table insight shows the transaction debit amount, credit amount, amount, and gross amount by transaction type |
| Debit & Credit Amount by GL Metrics [Drilldown] | This column insight shows the debit amount and credit amount by GL account type. Select an account type to view the amounts by account (number + name). Select an account to view the amounts by transaction type. Select a transaction type to view the amounts by GL account number. |
| GL Summary Table | This aggregated table insight shows the debit amount, credit amount, and gross amount by GL account type, account (number + name), GL account number, transaction type, and transaction date |
| GL Detail | This listing table insight shows the GL details, including: department, currency, GL account type, account (number + name), GL account number, transaction type, transaction date, debit amount, credit amount, and gross amount |
Example GL Summary Dashboard
